


Technical analysis - Page 7
September 21, 2026
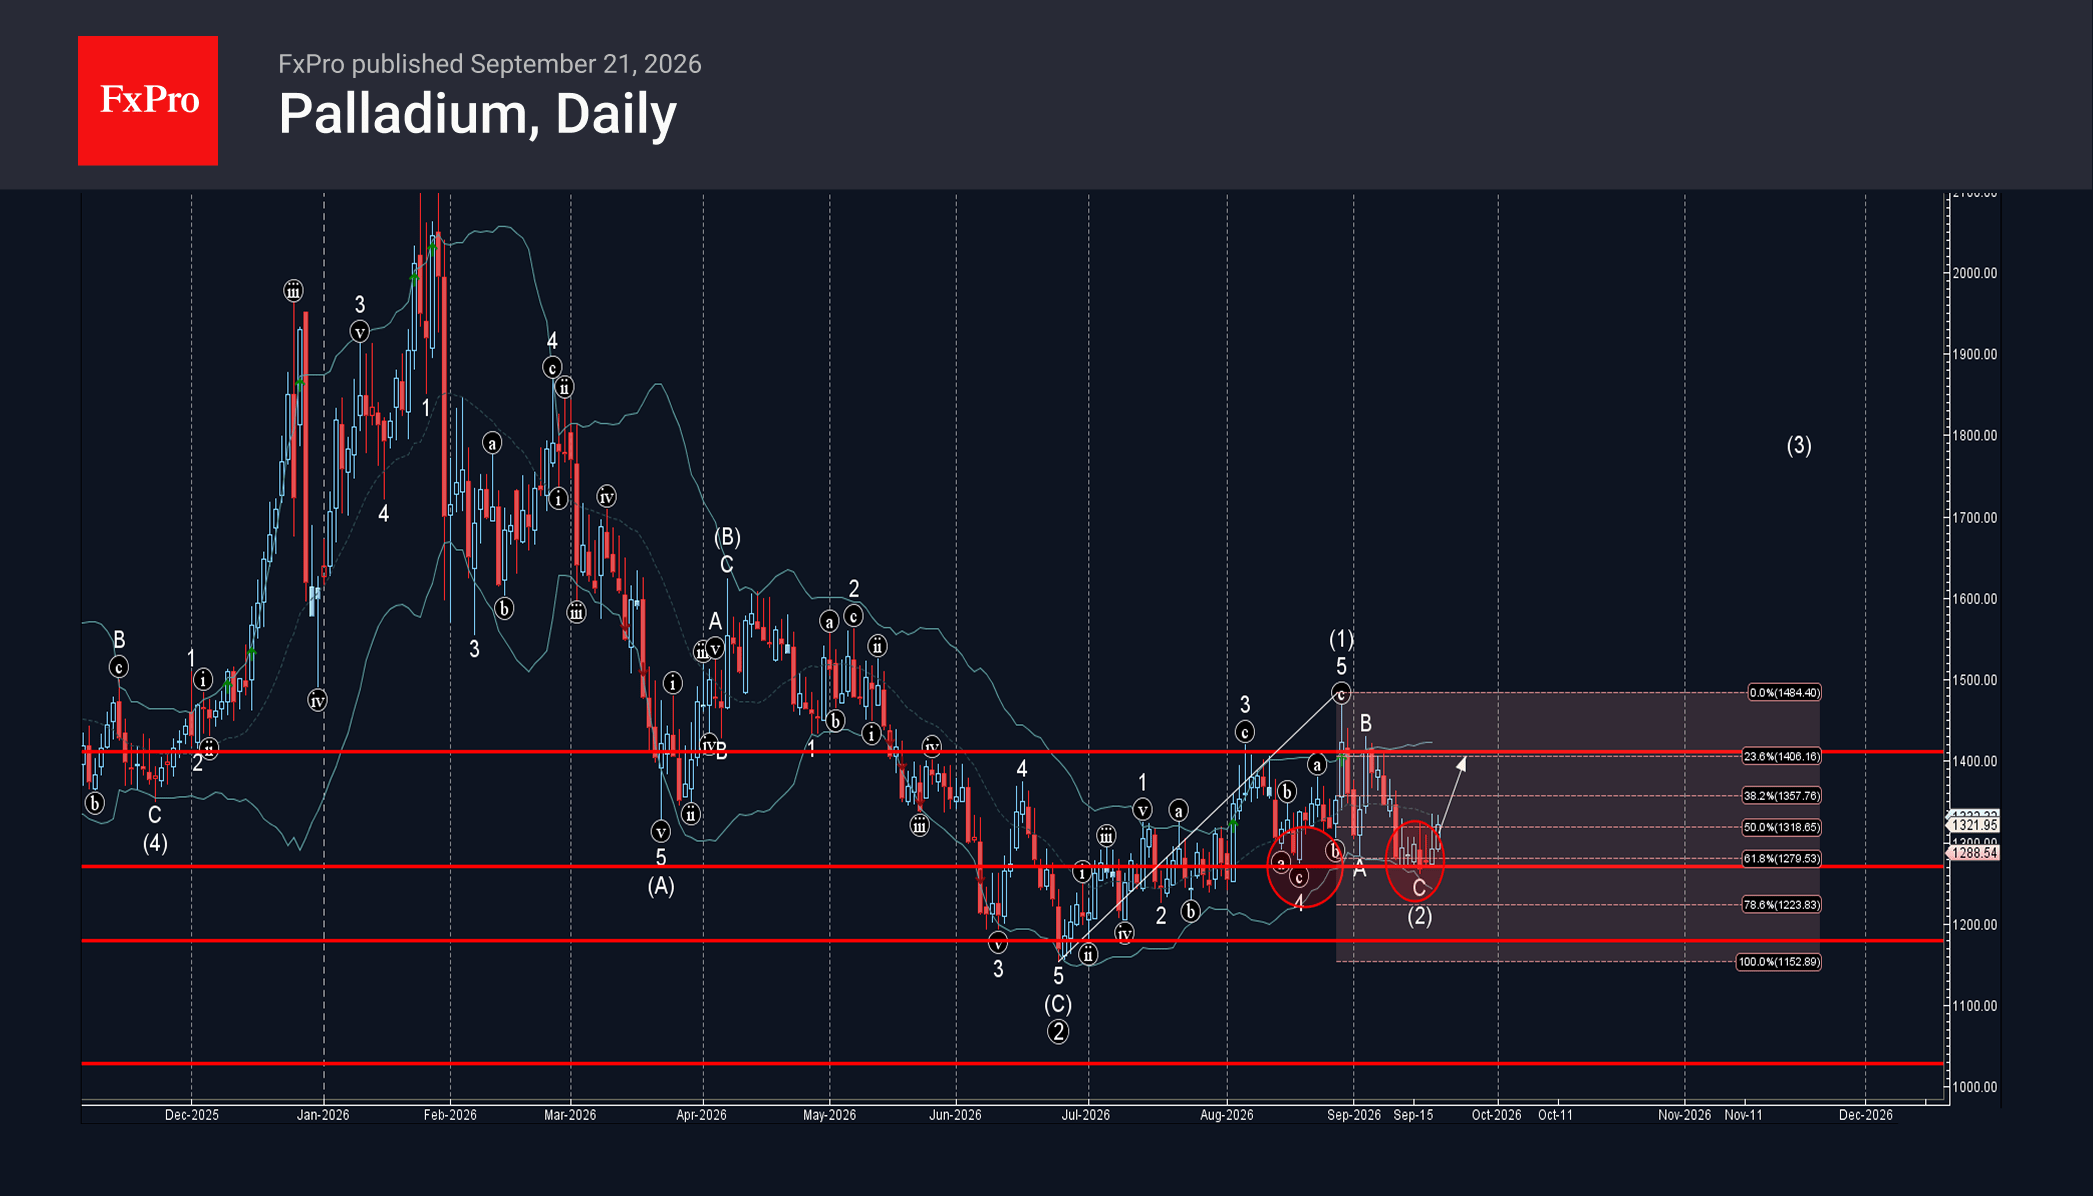
Palladium: ⬆️ Buy – Palladium reversed from support zone – Likely to rise to resistance level 1400.00 Palladium recently reversed up from the support zone located between the key support level 1288.50, the lower daily Bollinger Band and the 61.8%.
September 21, 2026
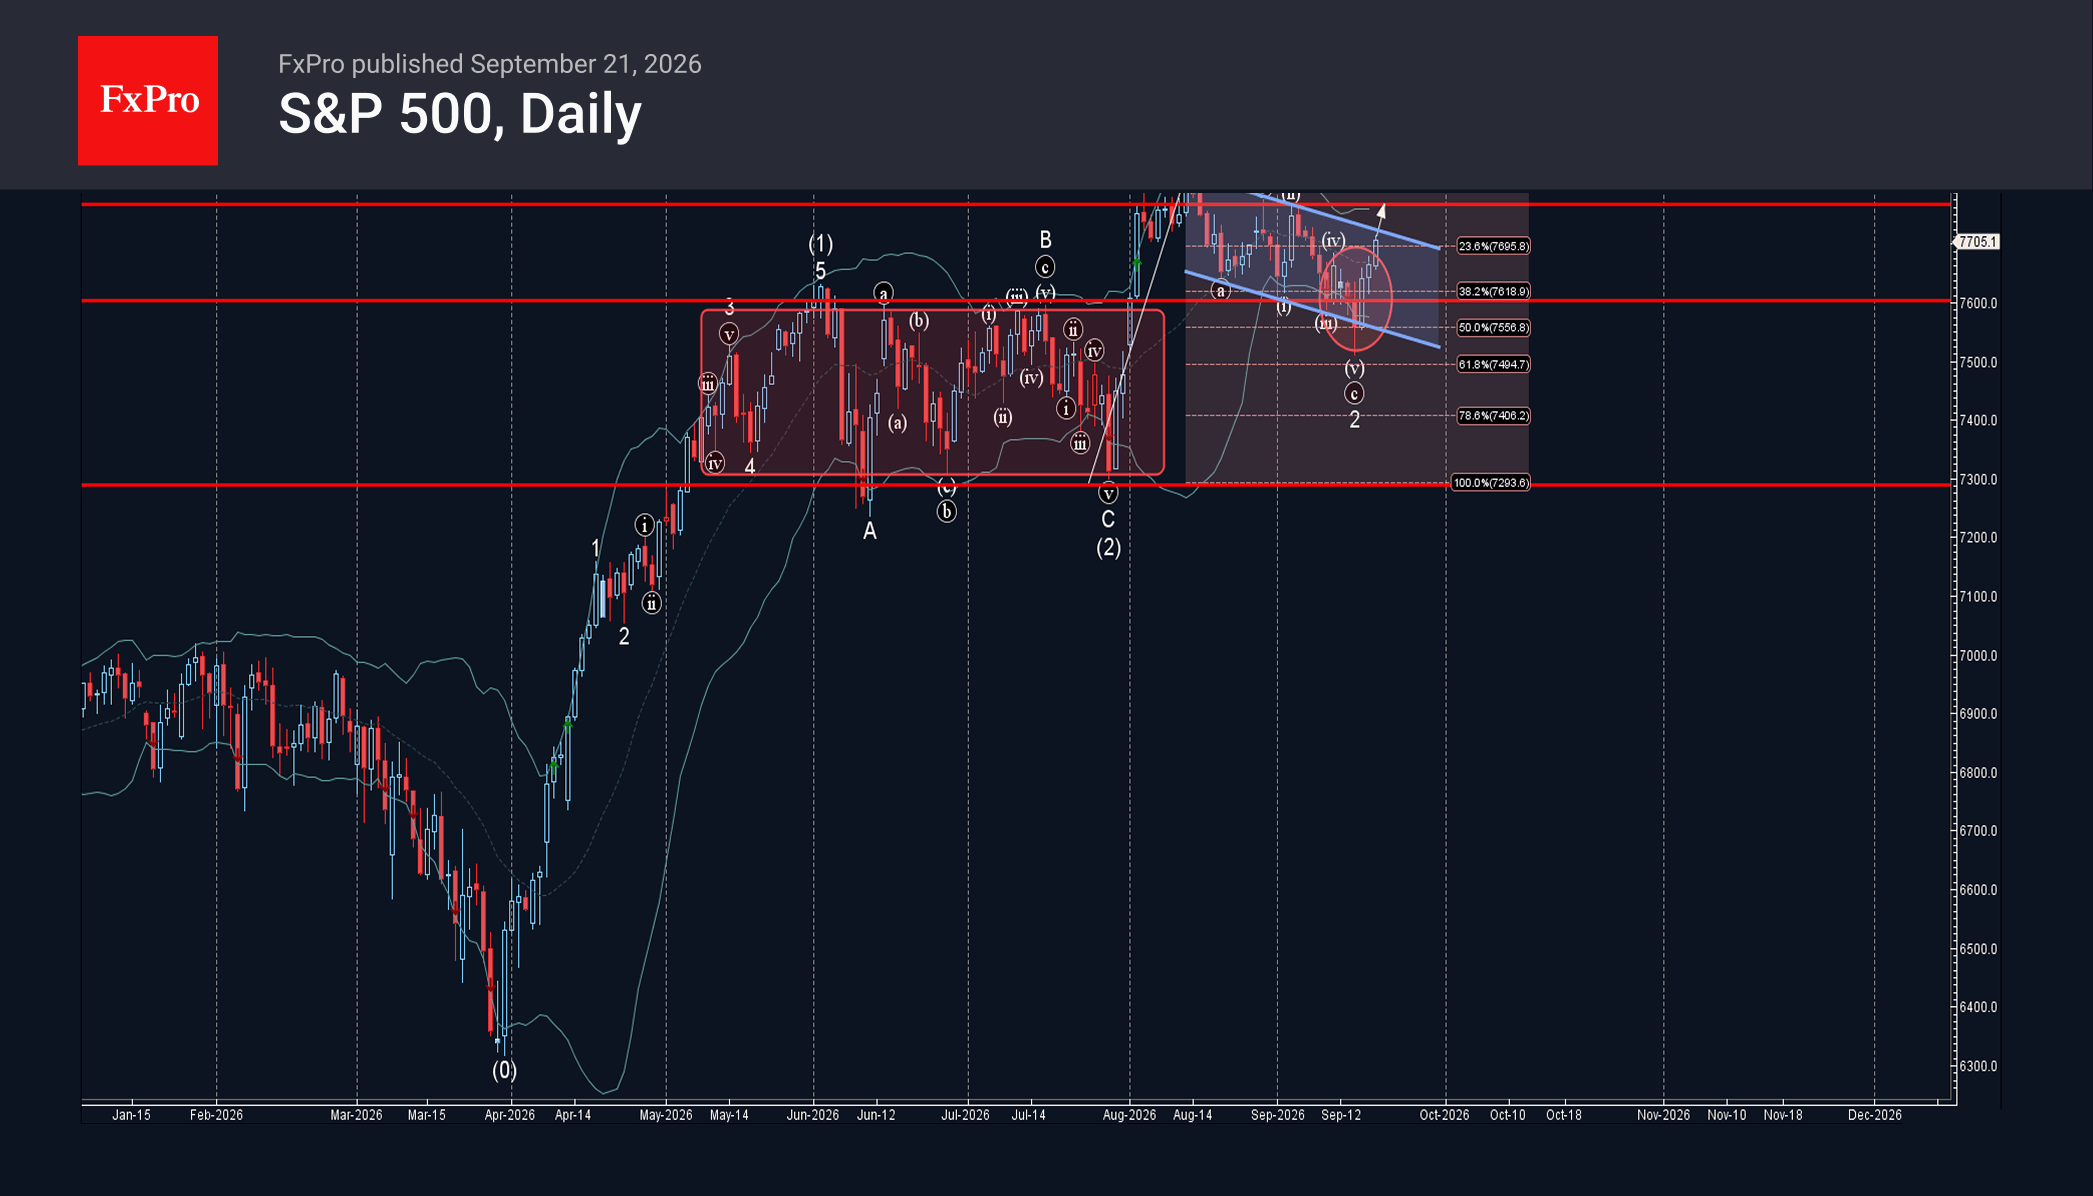
S&P 500 Index: ⬆️ Buy – S&P 500 Index reversed from support zone – Likely to rise to resistance level 7820.00 S&P 500 Index recently reversed up from the support zone between the 50% Fibonacci correction of the previous upward.
September 21, 2026
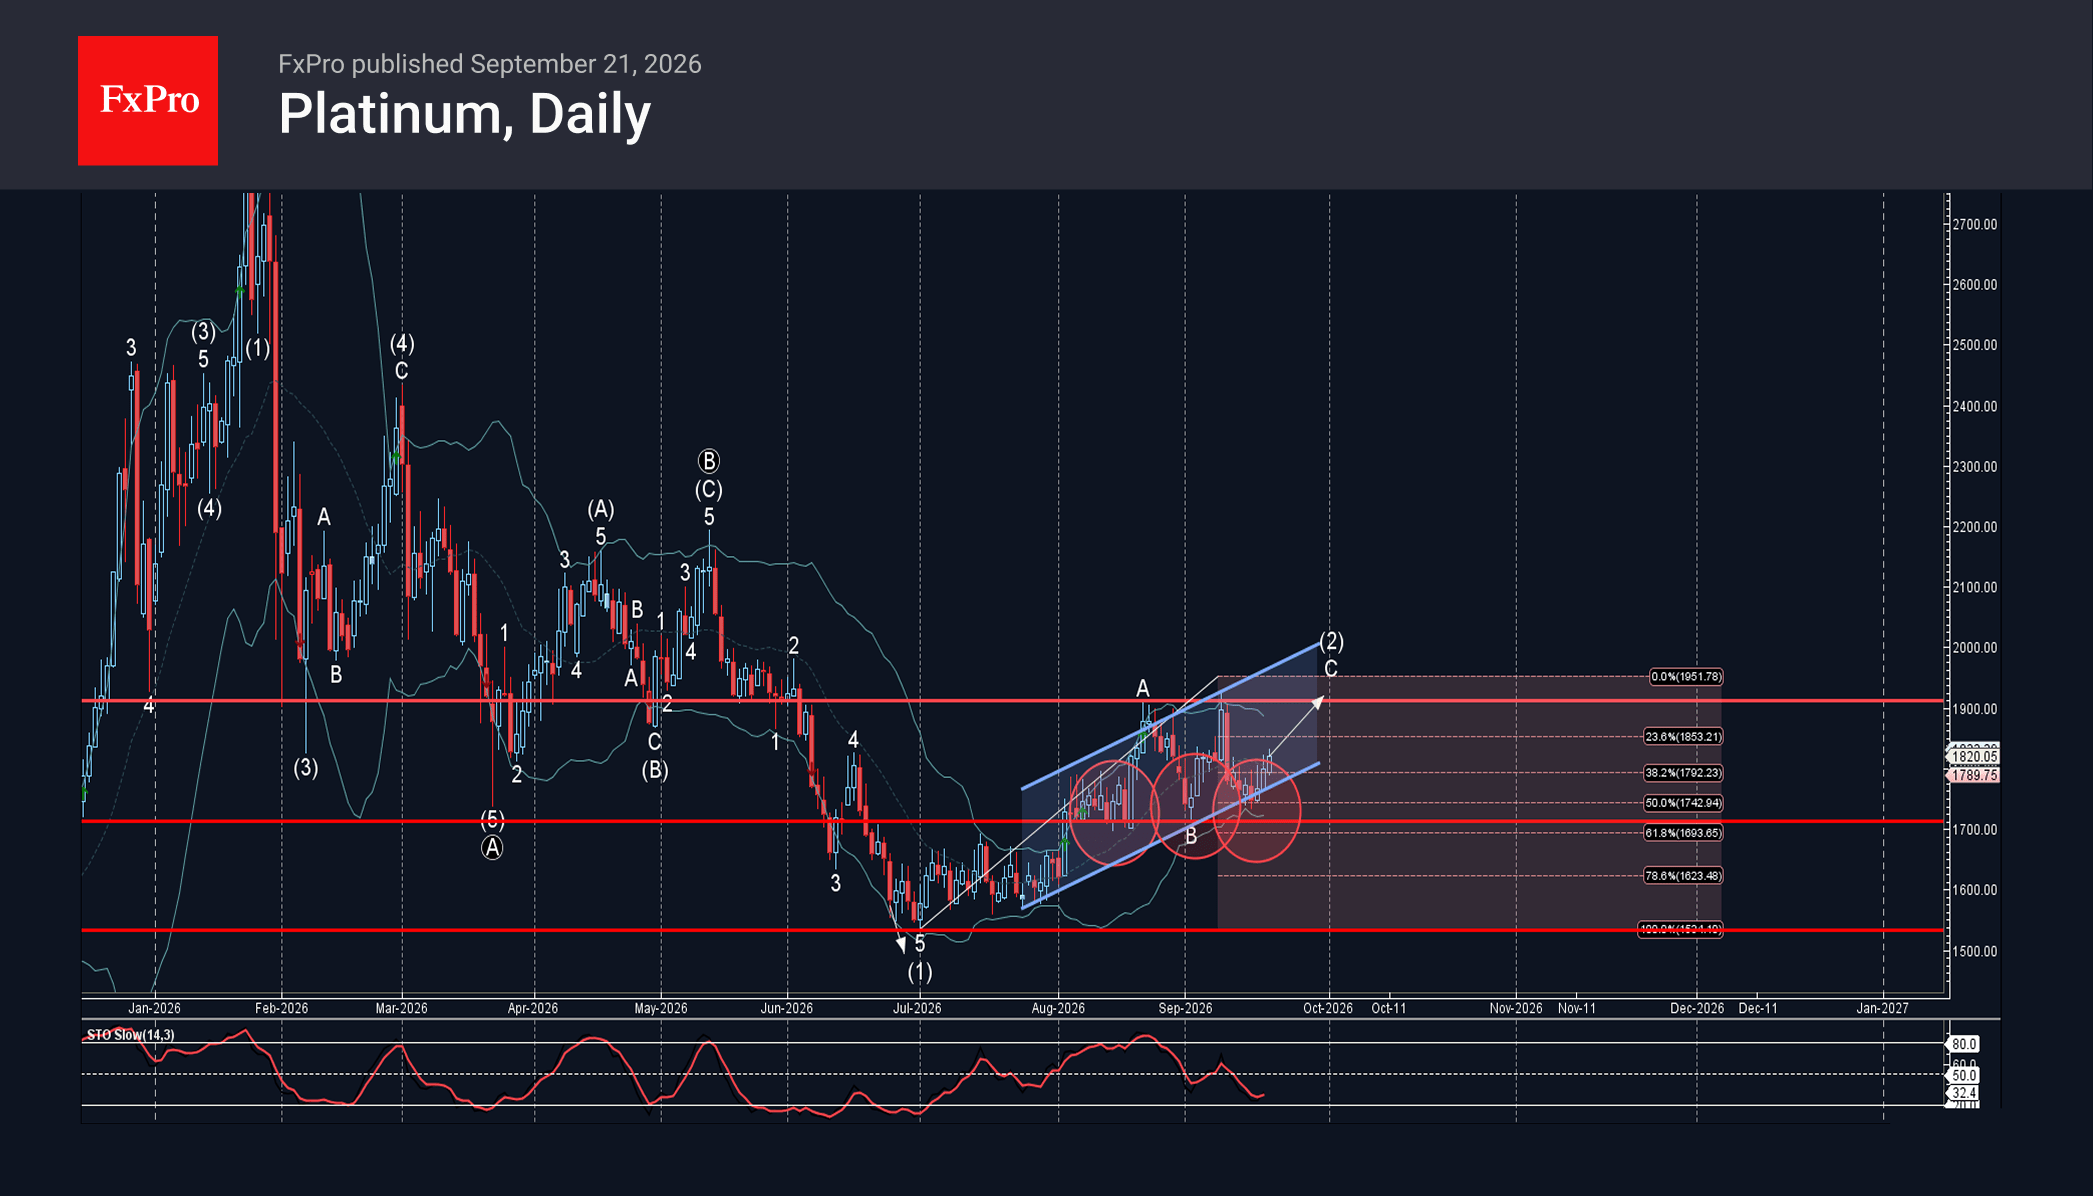
Platinum: ⬆️ Buy – Platinum reversed from support zone – Likely to rise to resistance level 1900.00 Platinum recently reversed up from the support zone between the lower daily Bollinger Band, 50% Fibonacci correction of the upward wave A from.
September 18, 2026
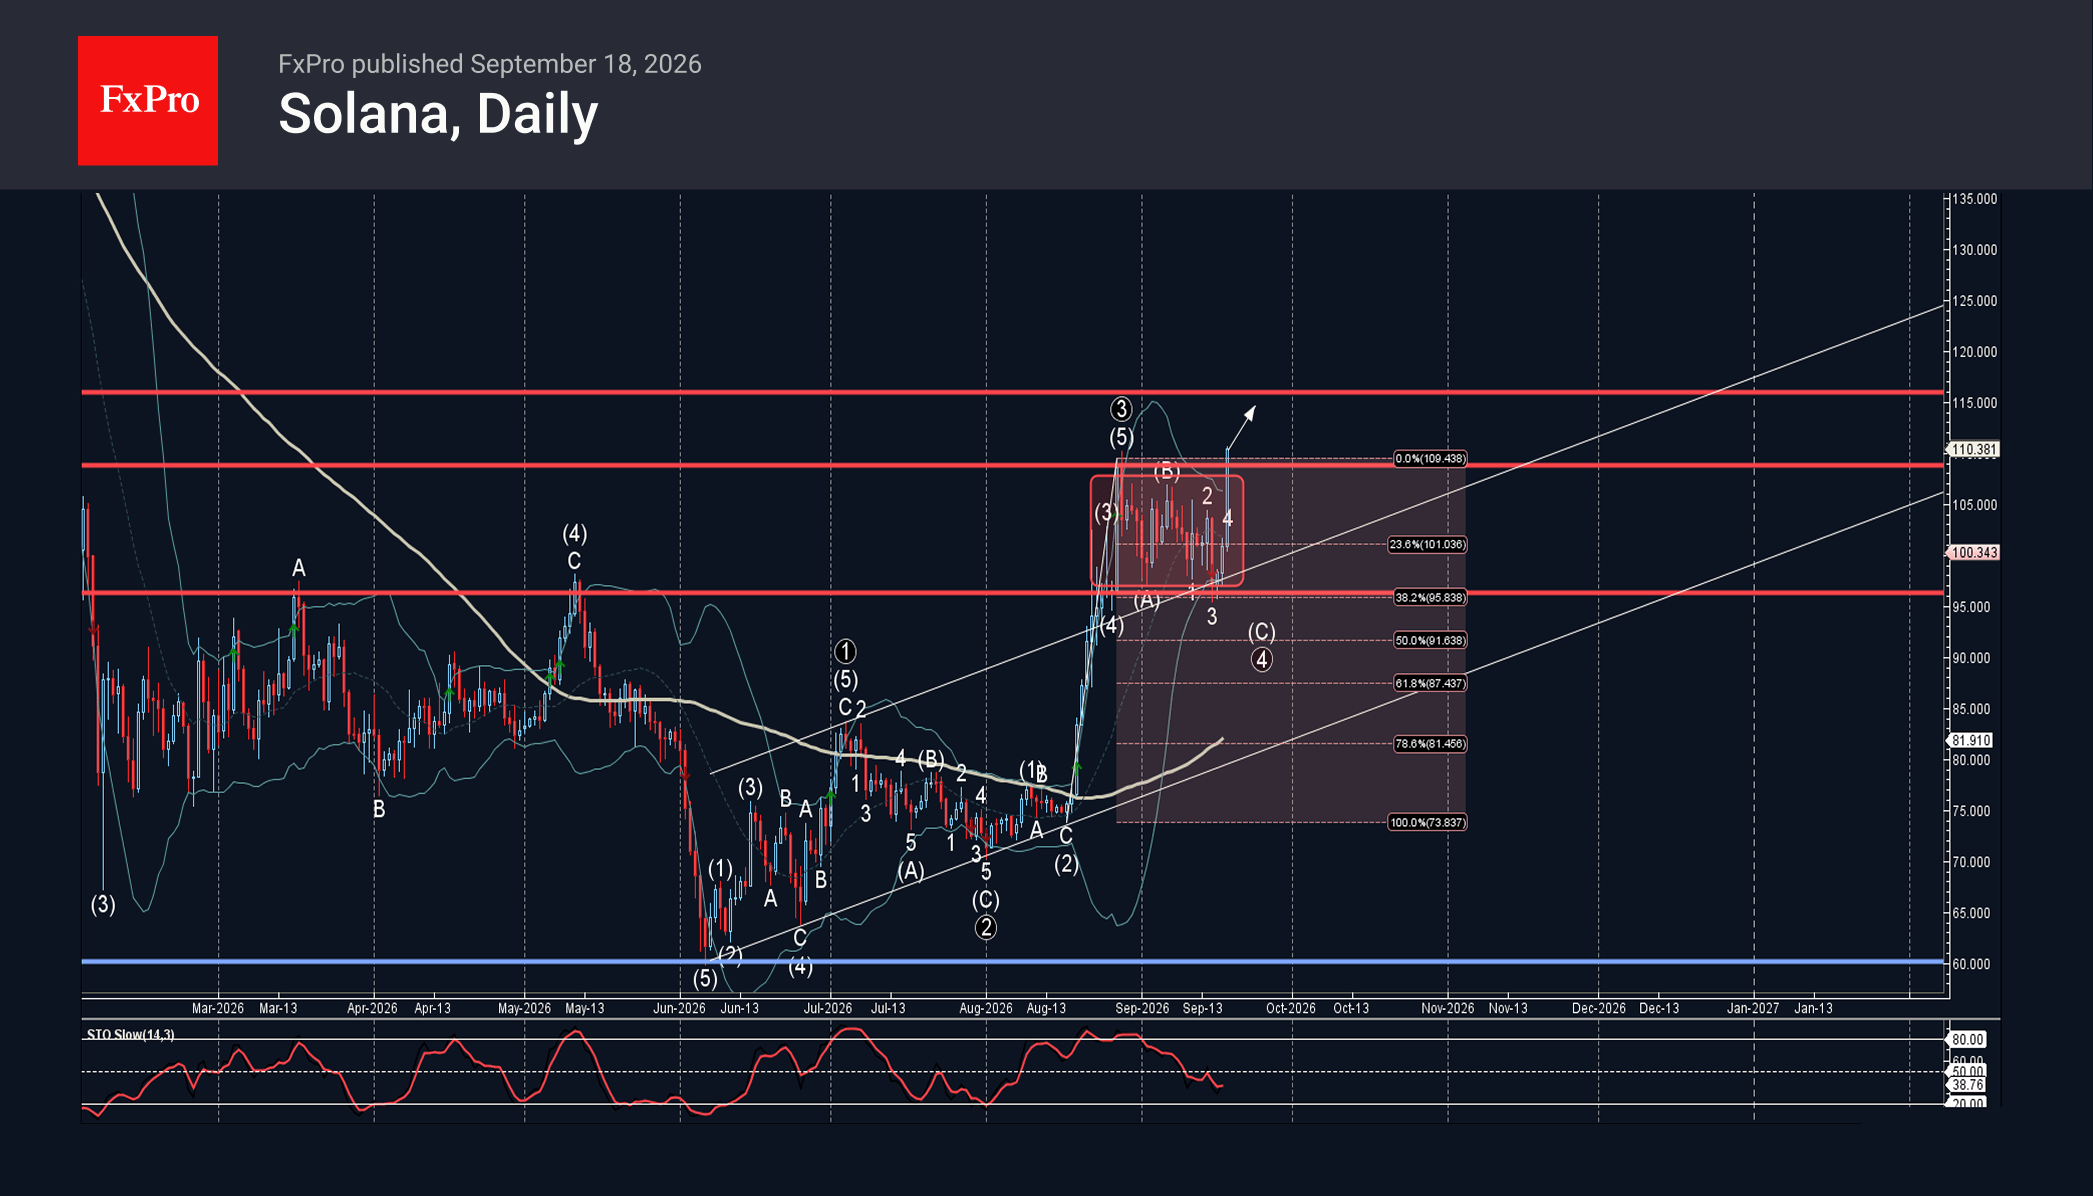
Solana: ⬆️ Buy – Solana breaks out of sideways price range – Likely to rise to resistance level 115.00 Solana cryptocurrency recently reversed up from the support zone located between the key support level 95.80 (lower boundary of the active.
September 18, 2026
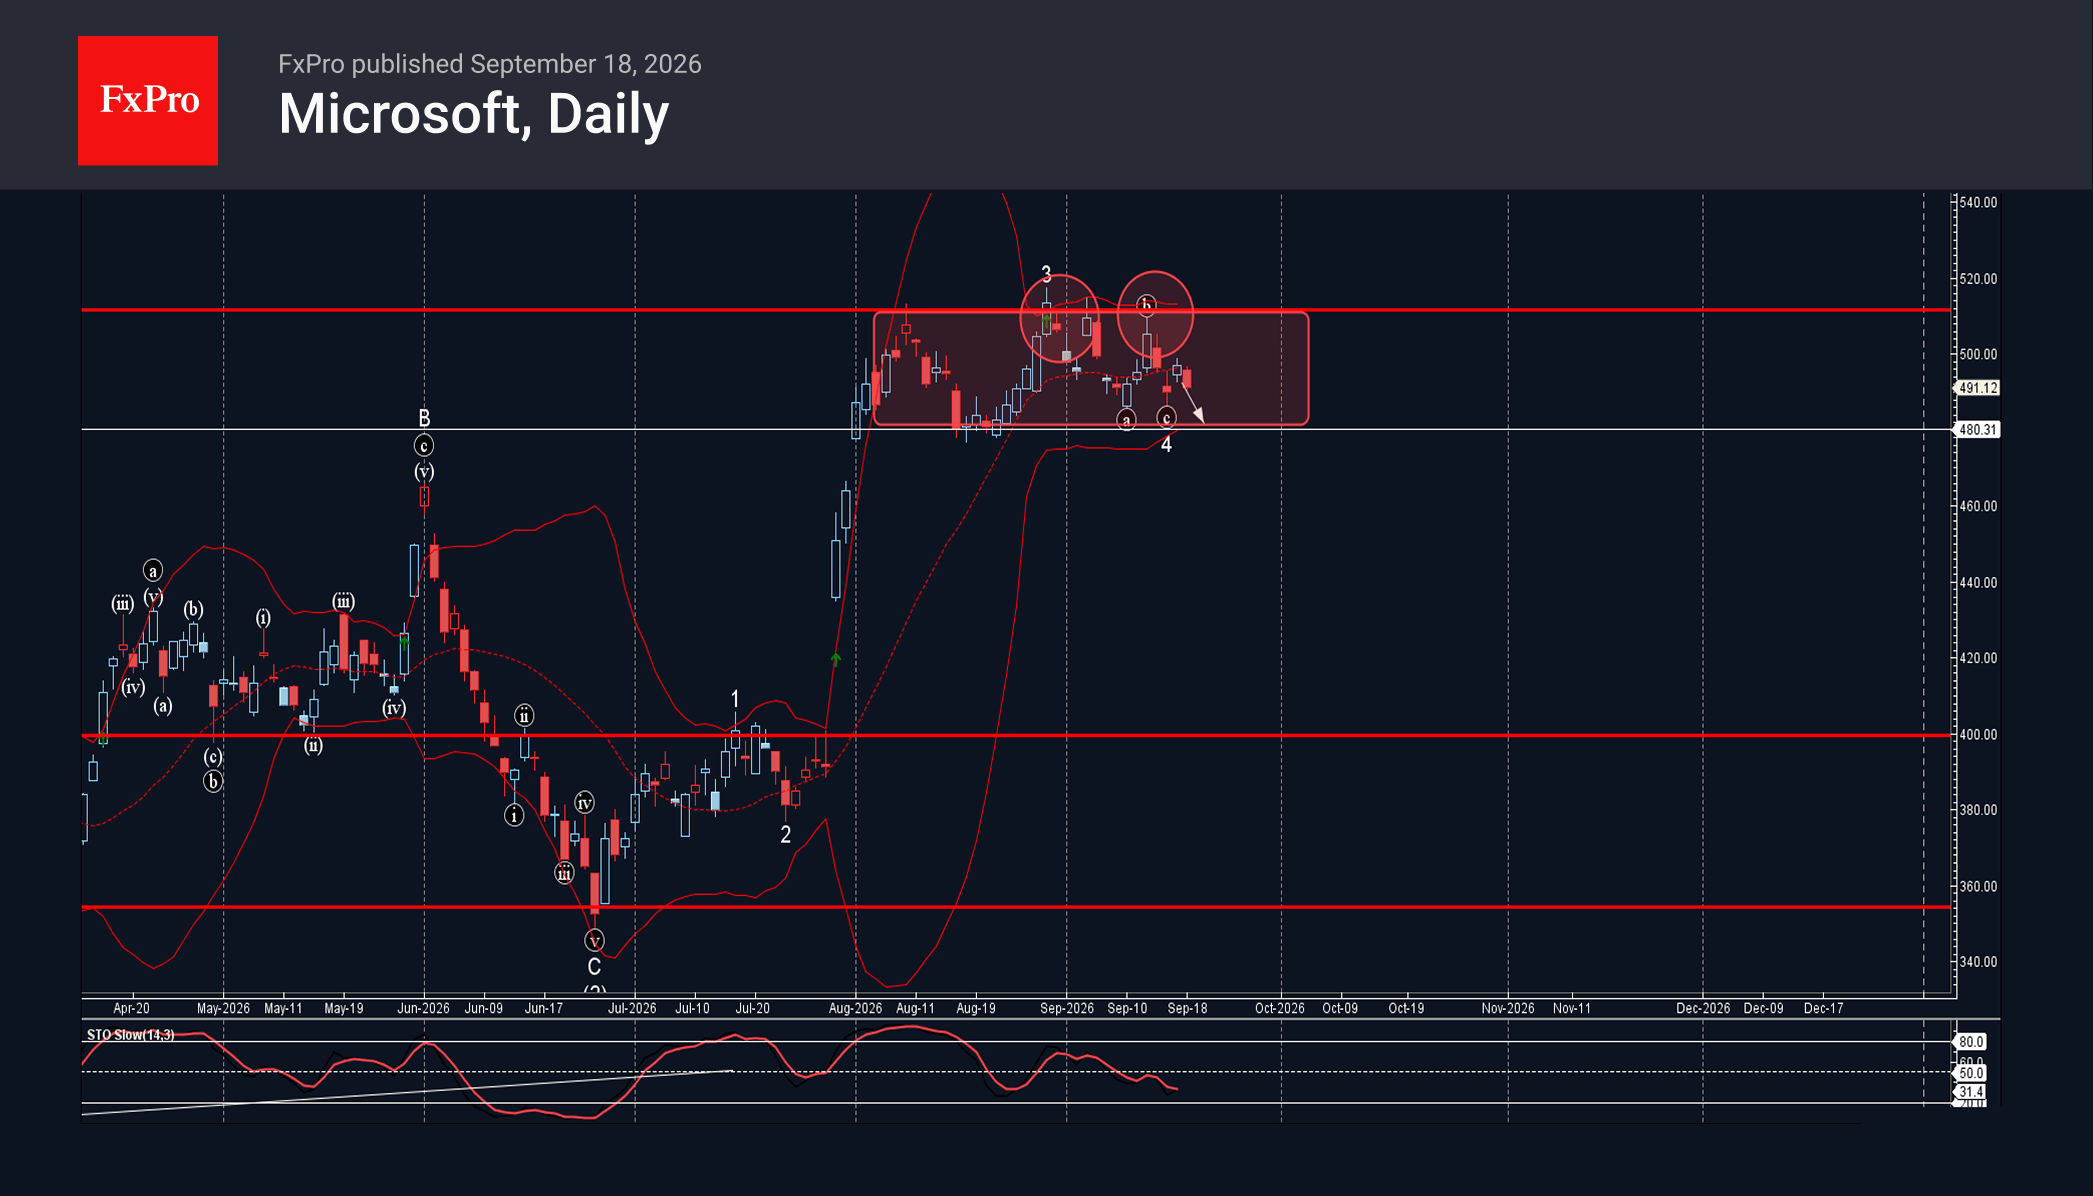
Microsoft: ⬇️ Sell – Microsoft reversed from resistance zone – Likely to fall to support level 480.30 Microsoft recently reversed down from the resistance zone located between the key resistance level 511.50 (the upper boundary of the active sideways price.
September 18, 2026
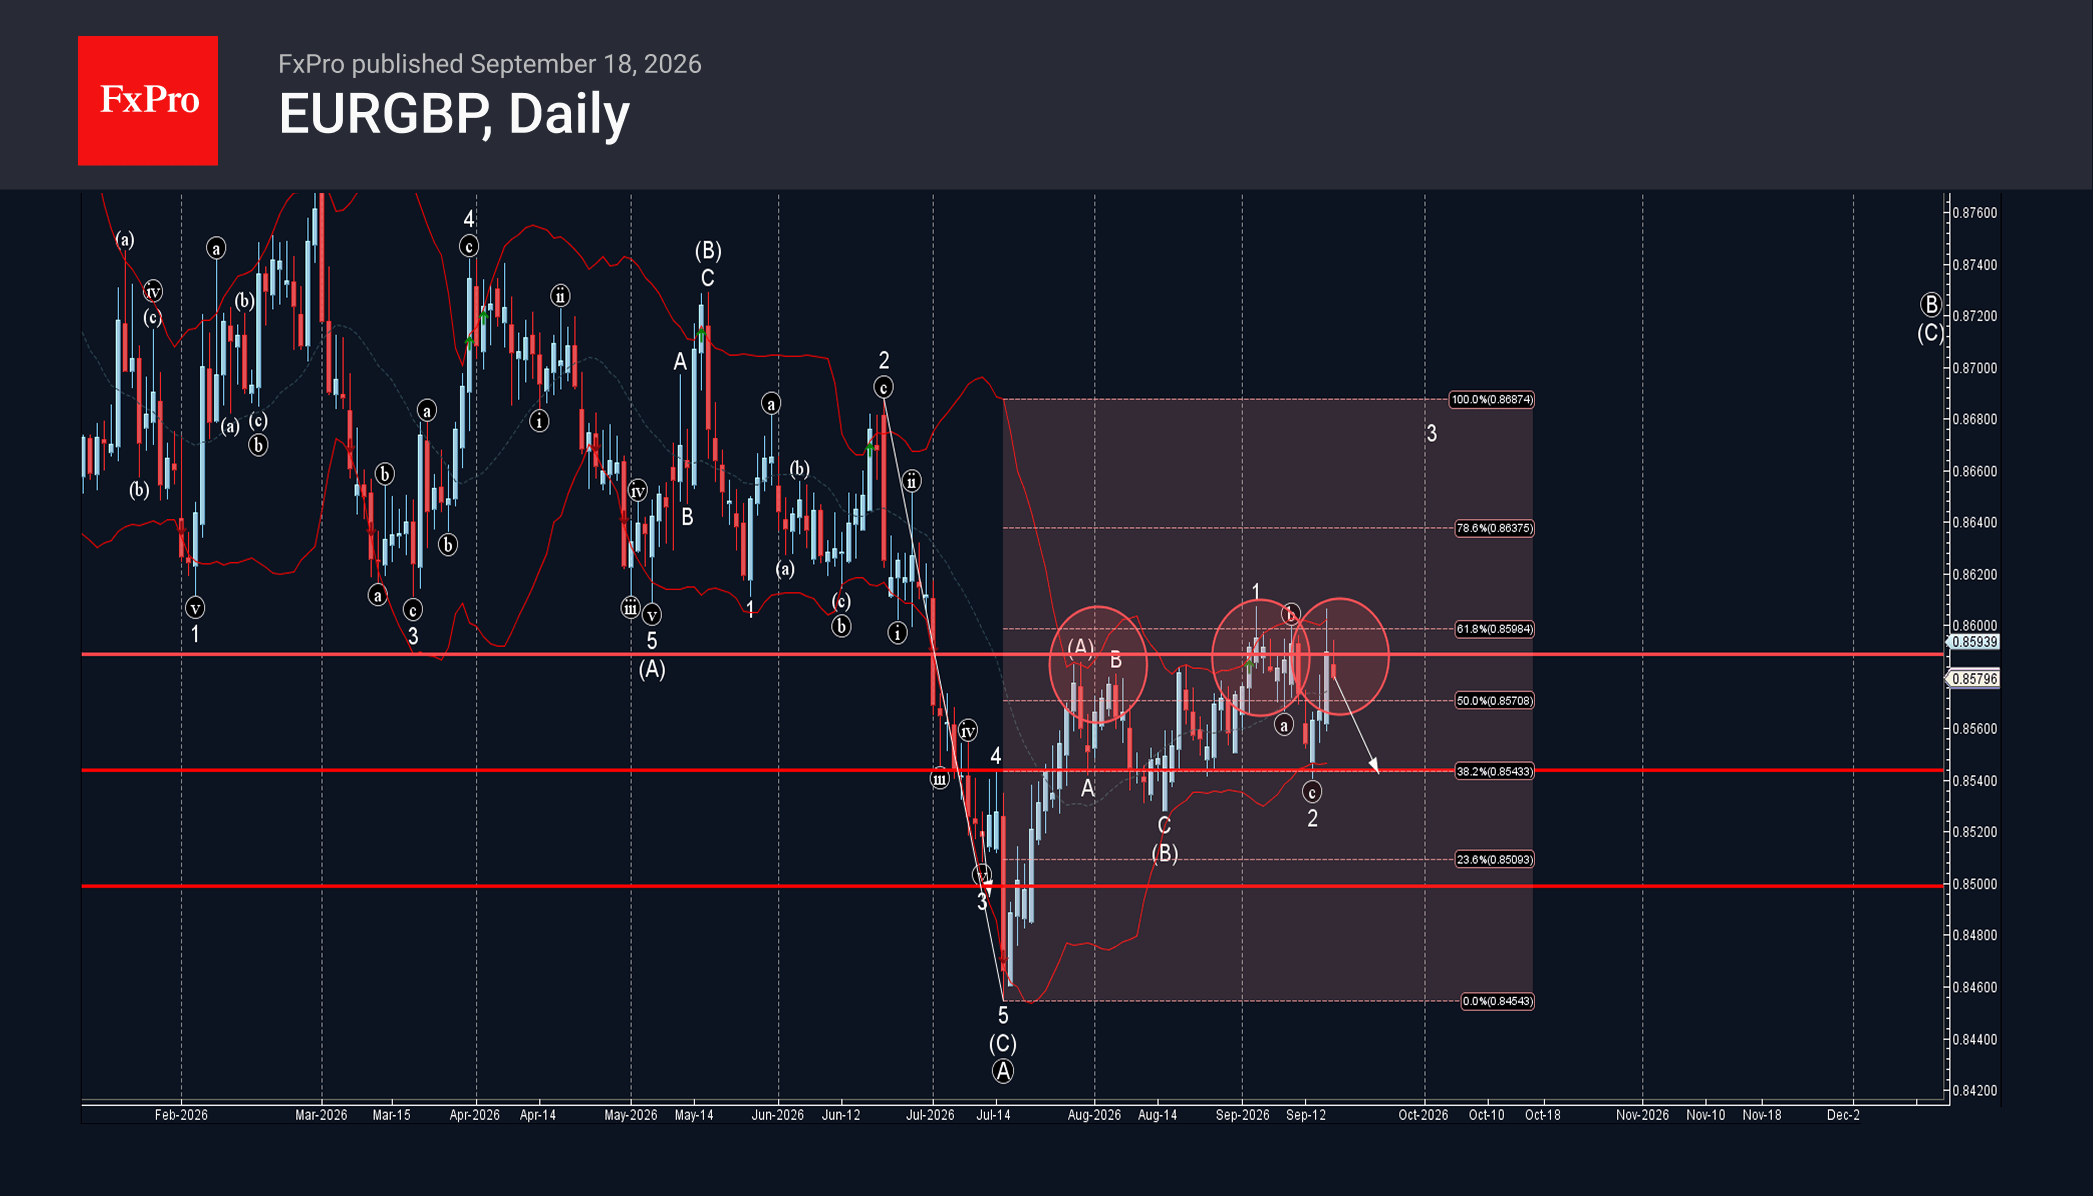
EURGBP: ⬇️ Sell – EURGBP reversed from resistance zone – Likely to fall to support level 0.8540 EURGBP currency pair recently reversed down from the resistance zone between the pivotal resistance level 0.8590 (which stopped the previous wave 1 in.
September 18, 2026
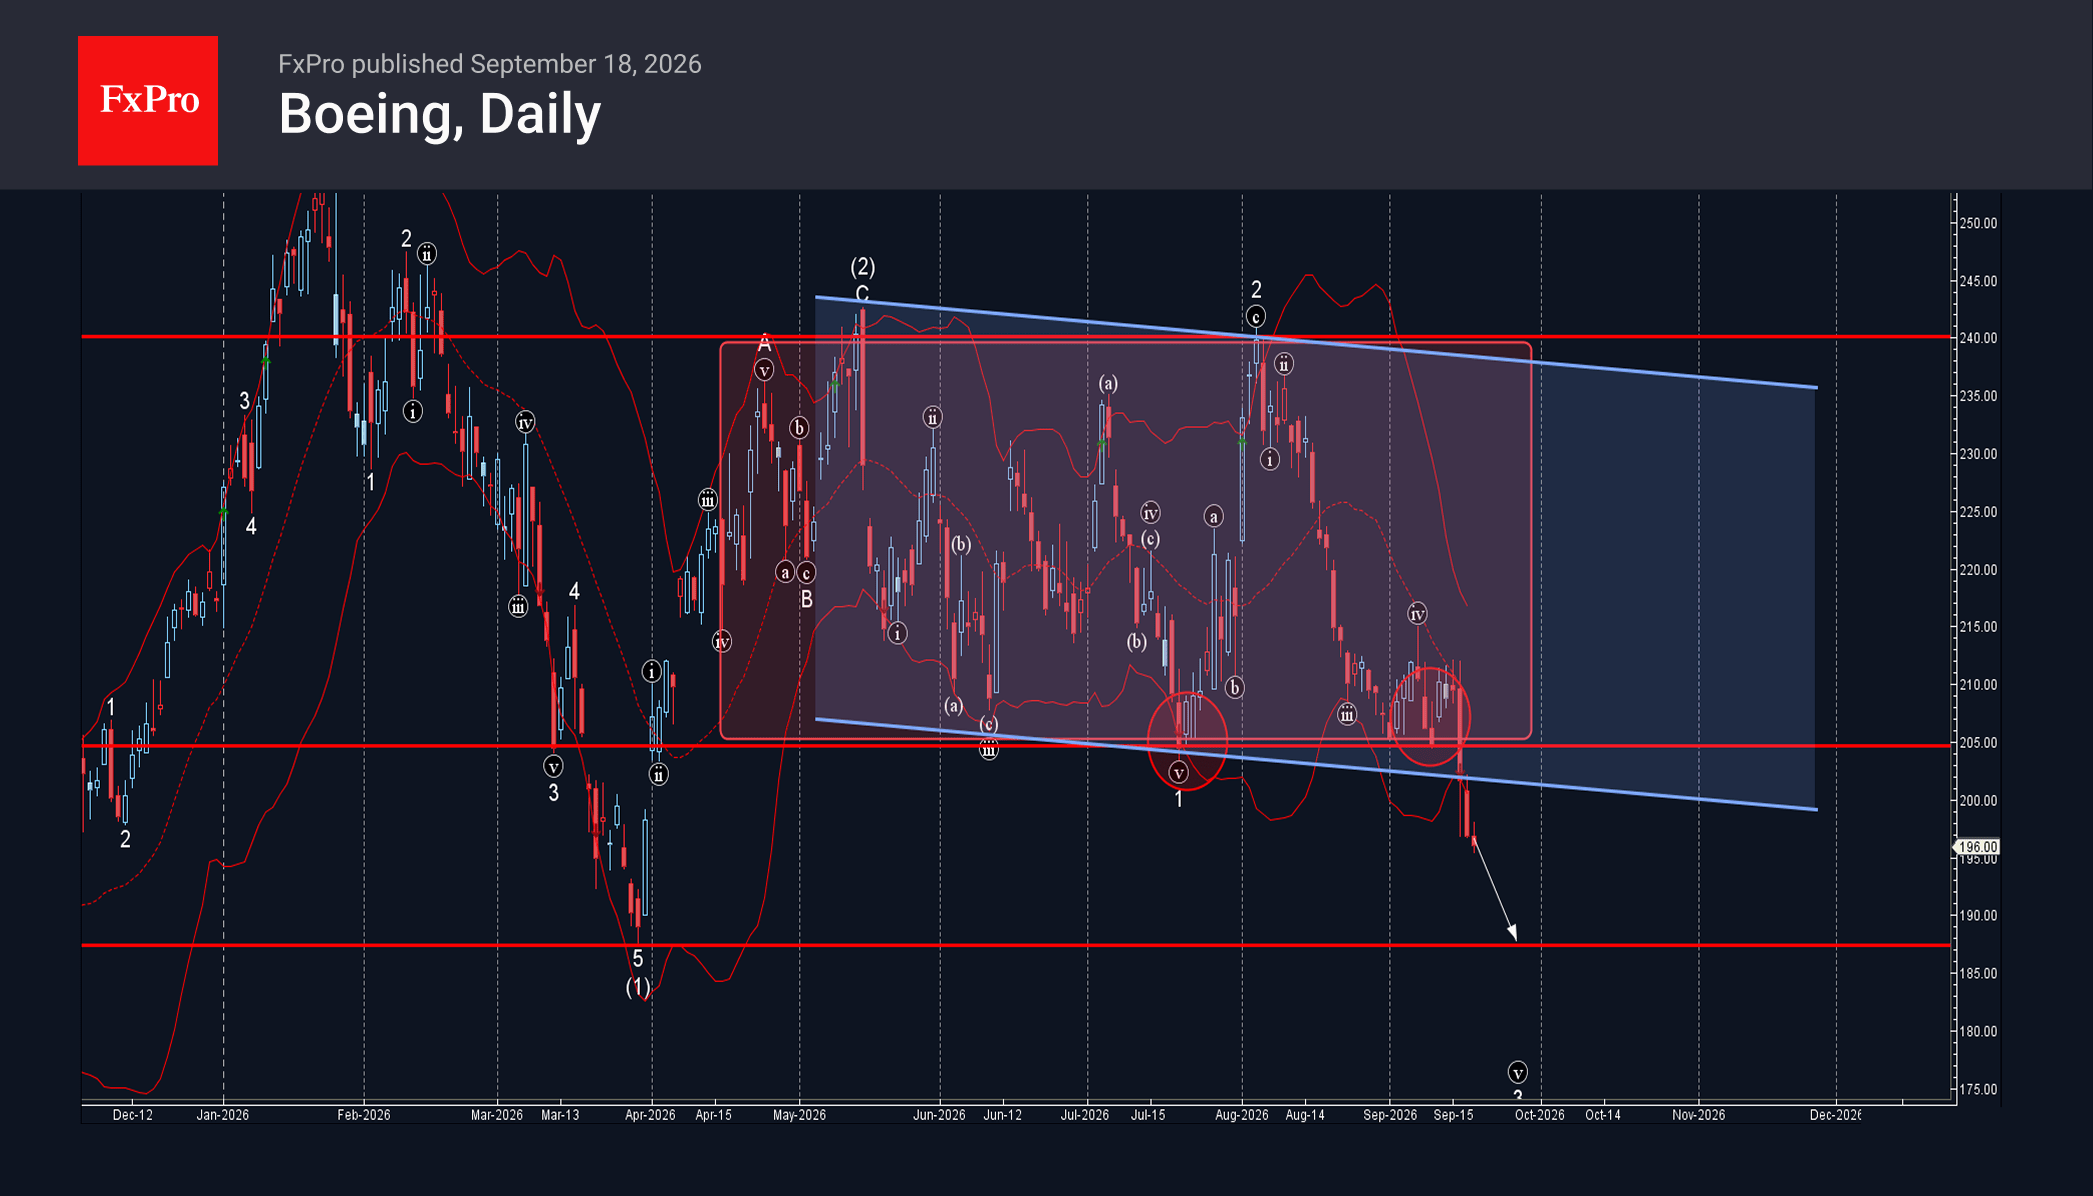
Boeing: ⬇️ Sell – Boeing broke support level 205.00 – Likely to fall to support level 188.00 Boeing shares recently broke through the support zone between the key support level 205.00 (which has been reversing the price from July) and.
September 17, 2026
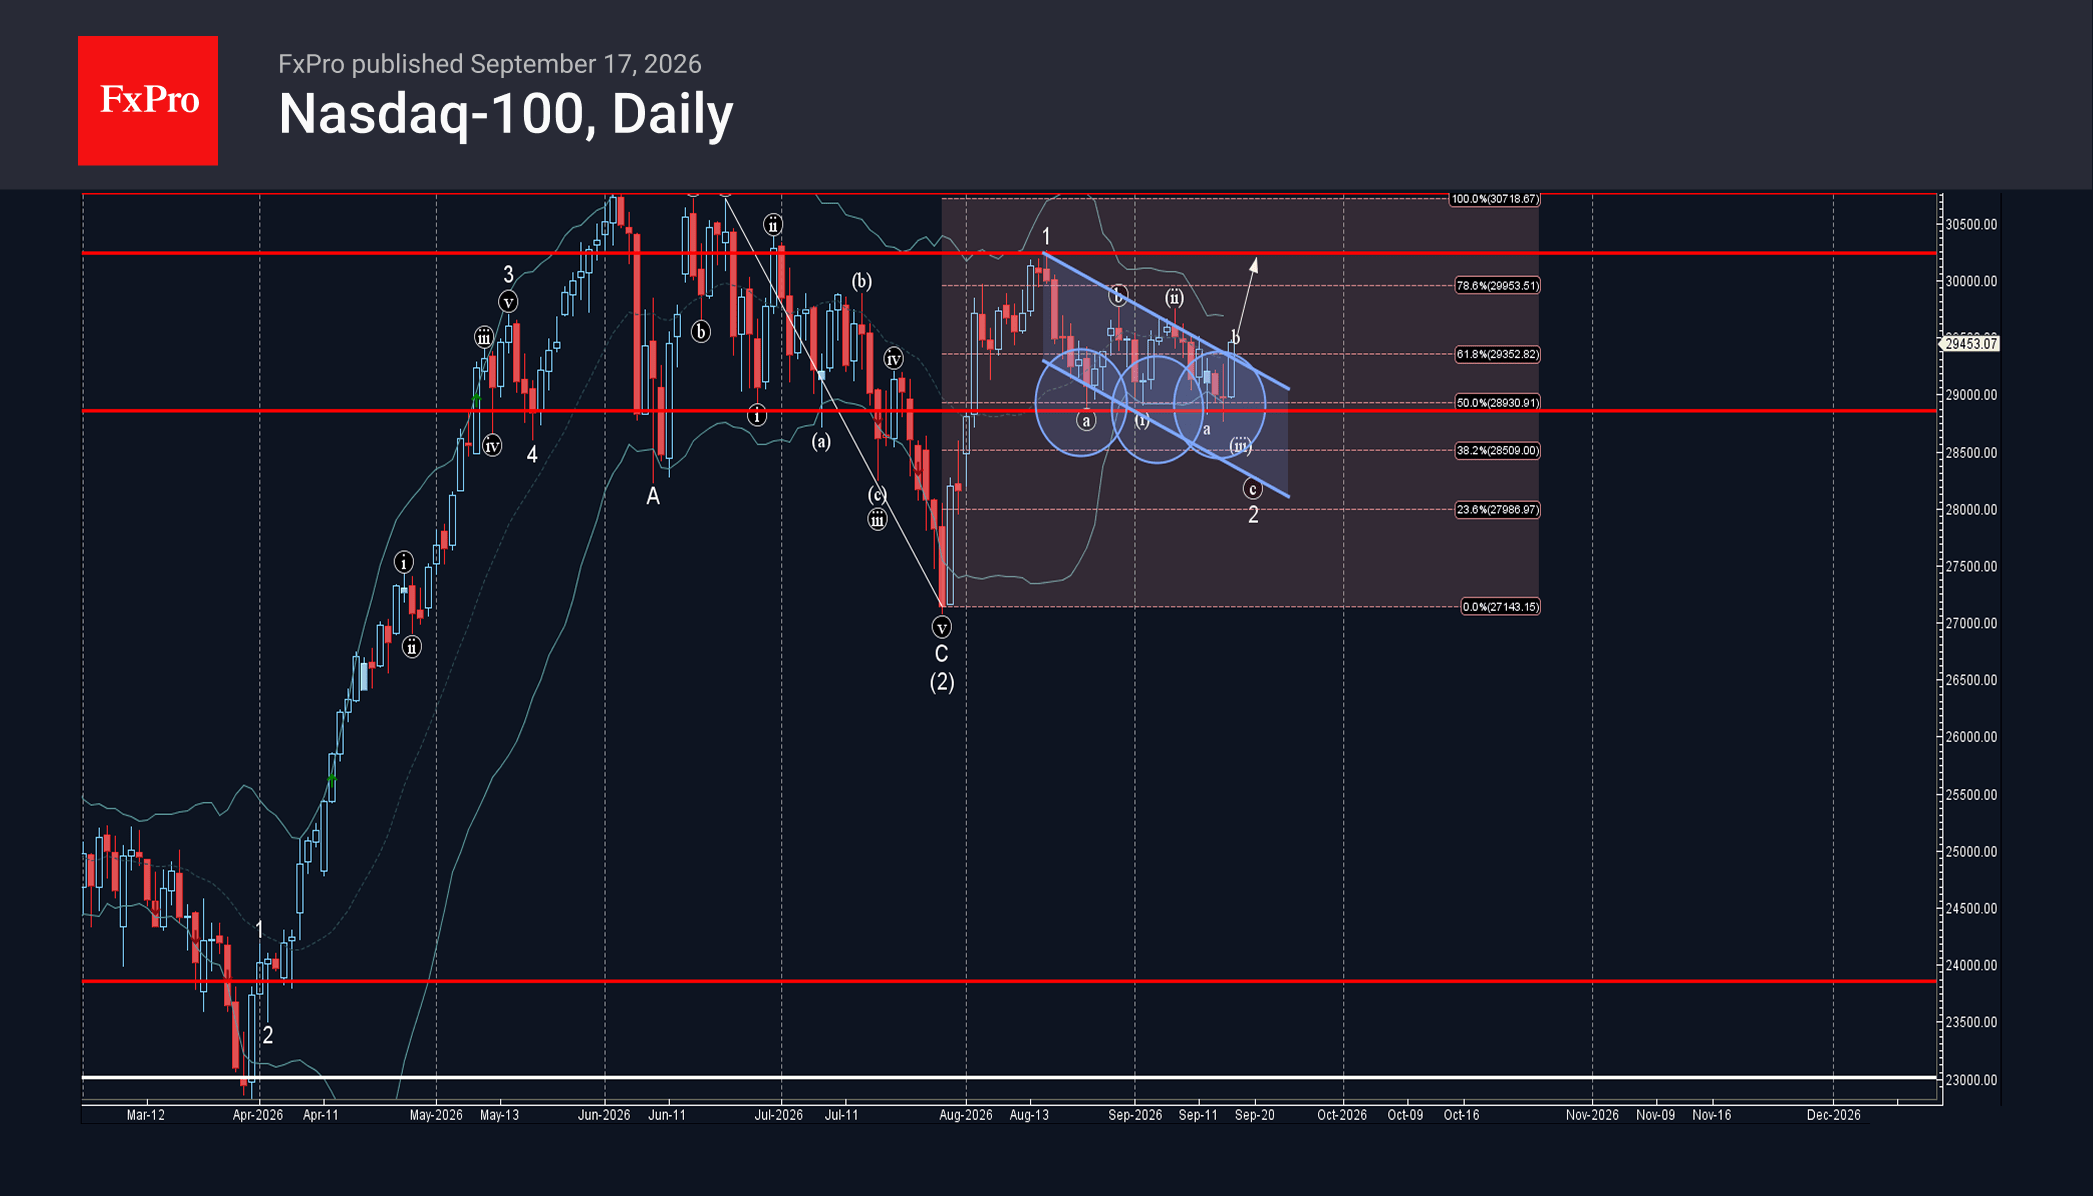
Nasdaq-100: ⬆️ Buy – Nasdaq-100 broke daily down channel – Likely to rise to resistance level 30240.00 Nasdaq-100 index today broke the resistance trendline of the daily down channel from August – which enclosed the previous minor ABC correction 2..
September 17, 2026
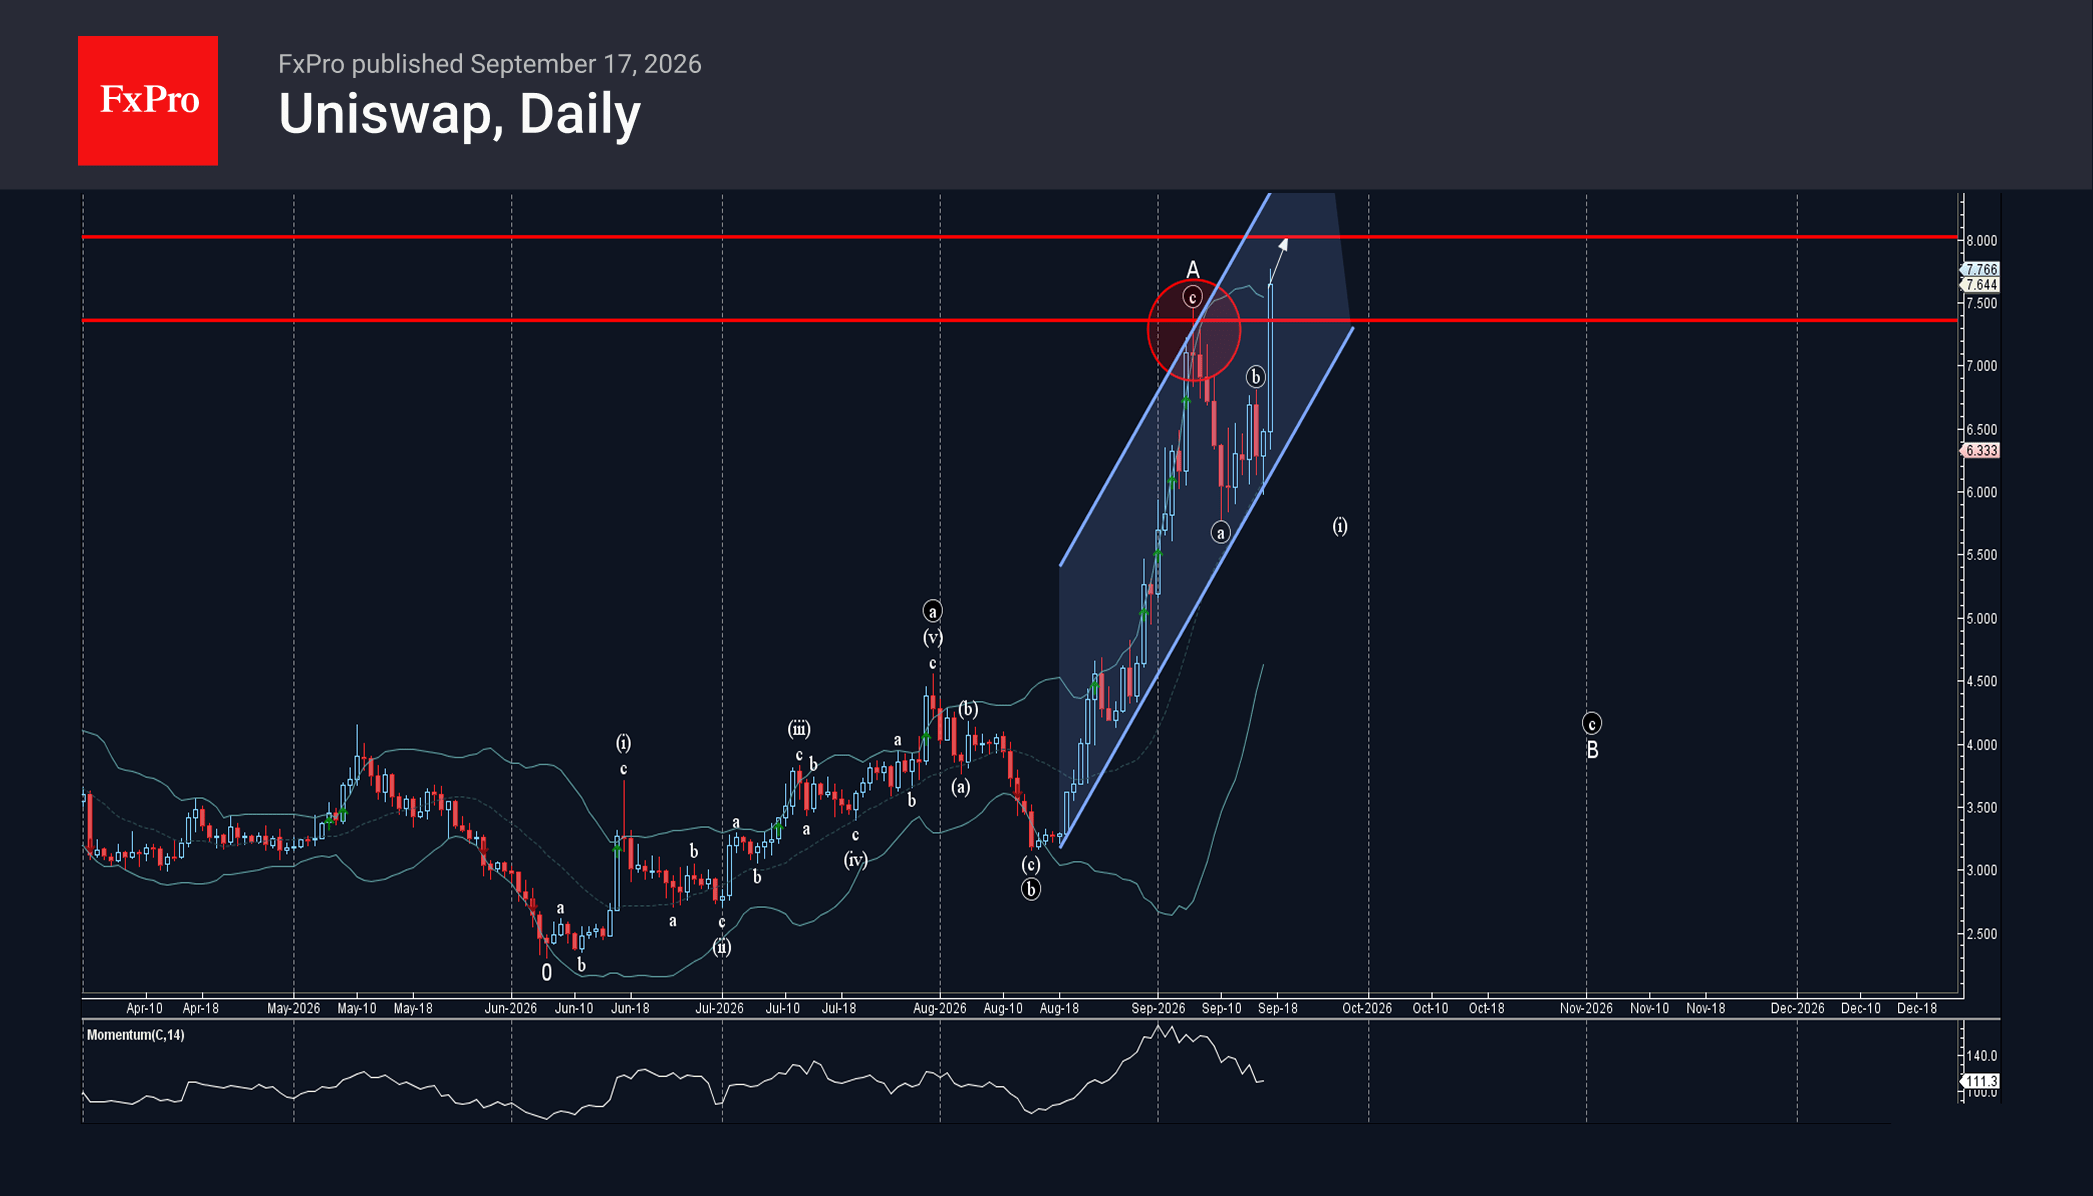
Uniswap: ⬆️ Buy – Uniswap broke resistance level 7.360 – Likely to rise to resistance level 8.00 Cryptocurrency Uniswap recently broke the resistance zone between the resistance level 7.360 (which stopped the previous impulse wave A) and the resistance trendline.
September 17, 2026
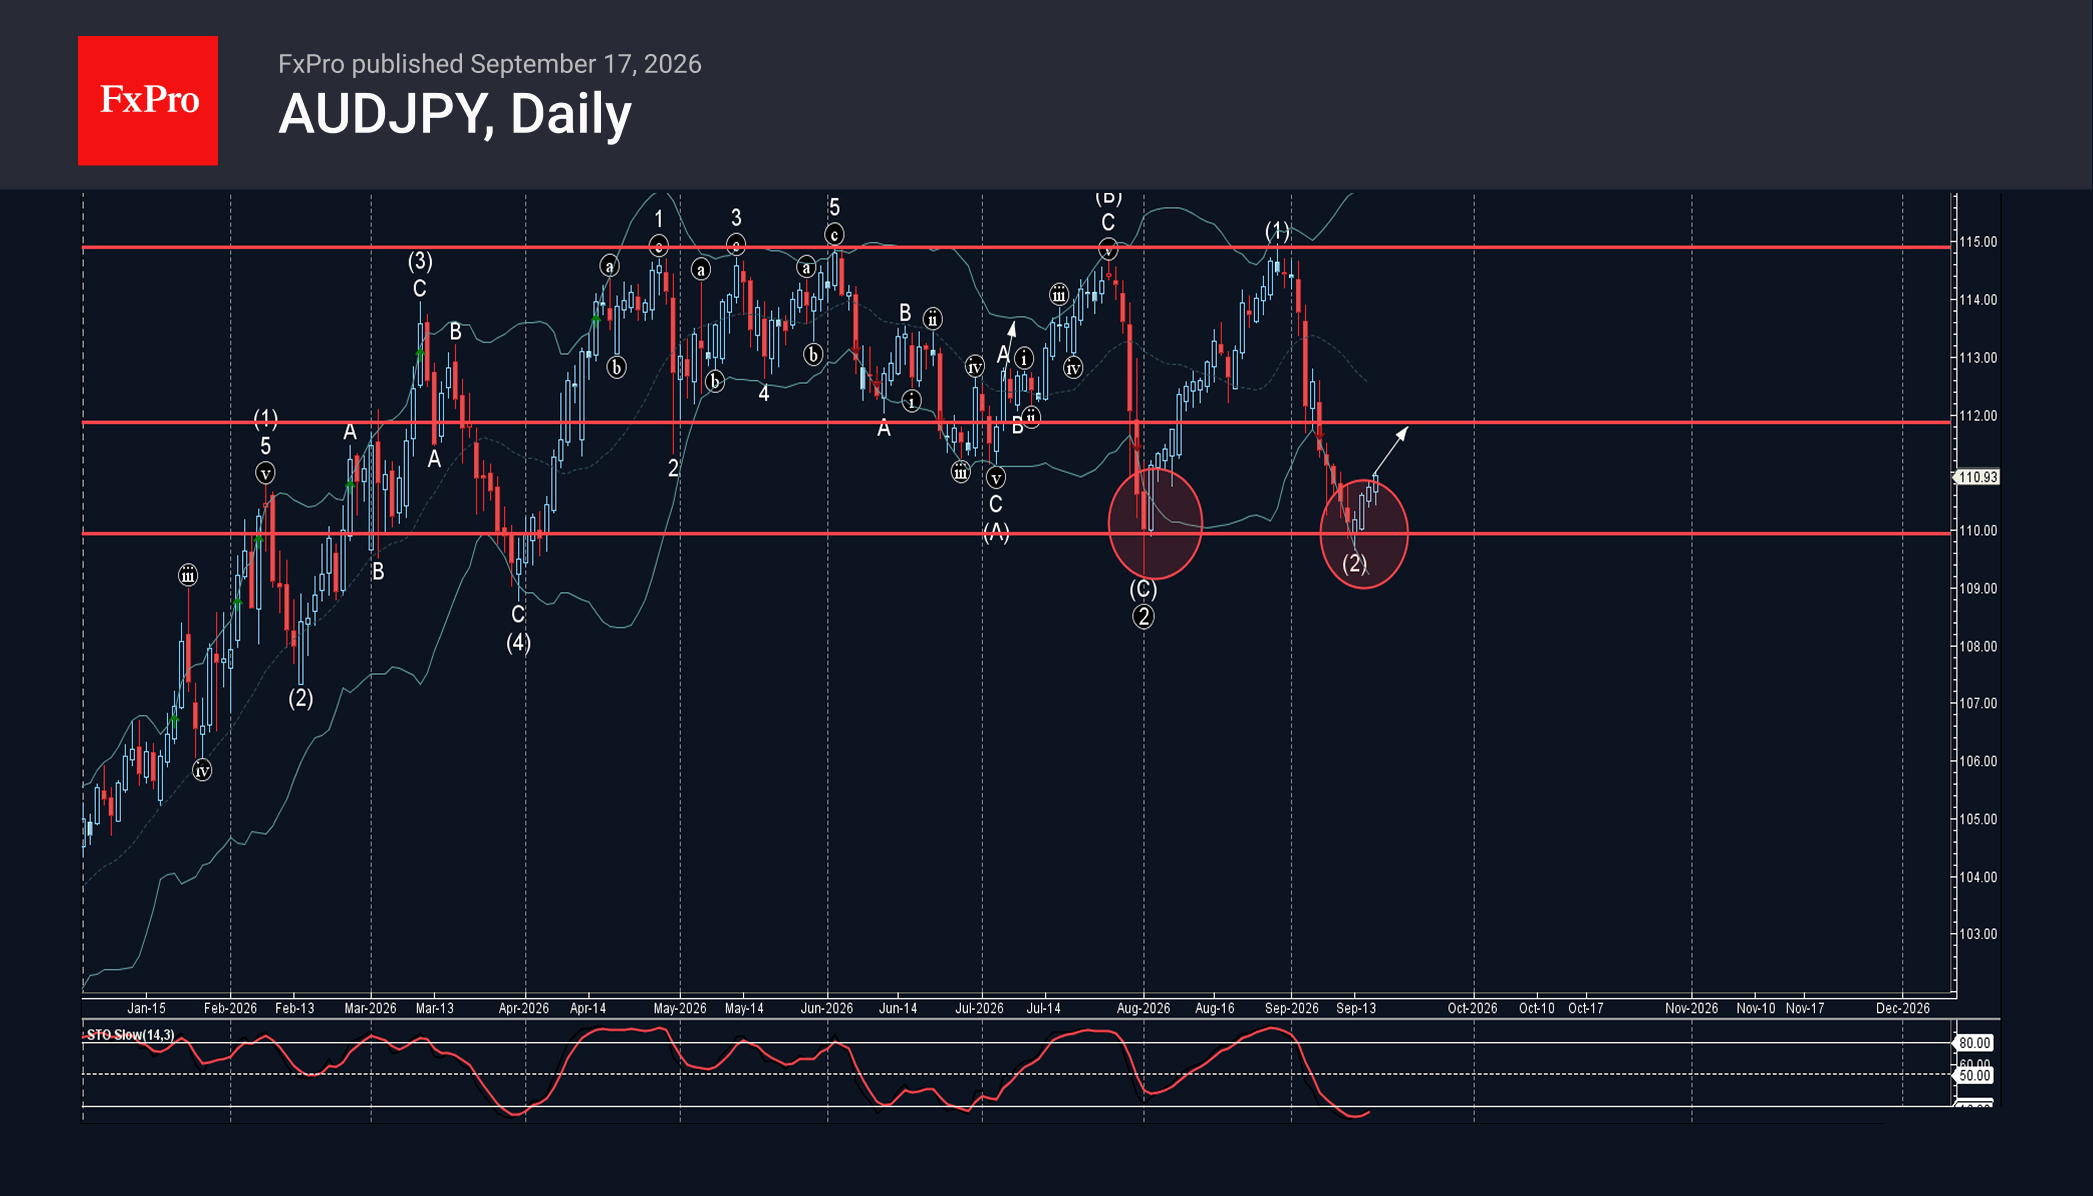
AUDJPY: ⬆️ Buy – AUDJPY reversed from support level 110.00 – Likely to rise to resistance level 112.00 AUDJPY currency pair recently reversed from the support zone between the key support level 110.00 (which has been reversing the price from.
September 17, 2026
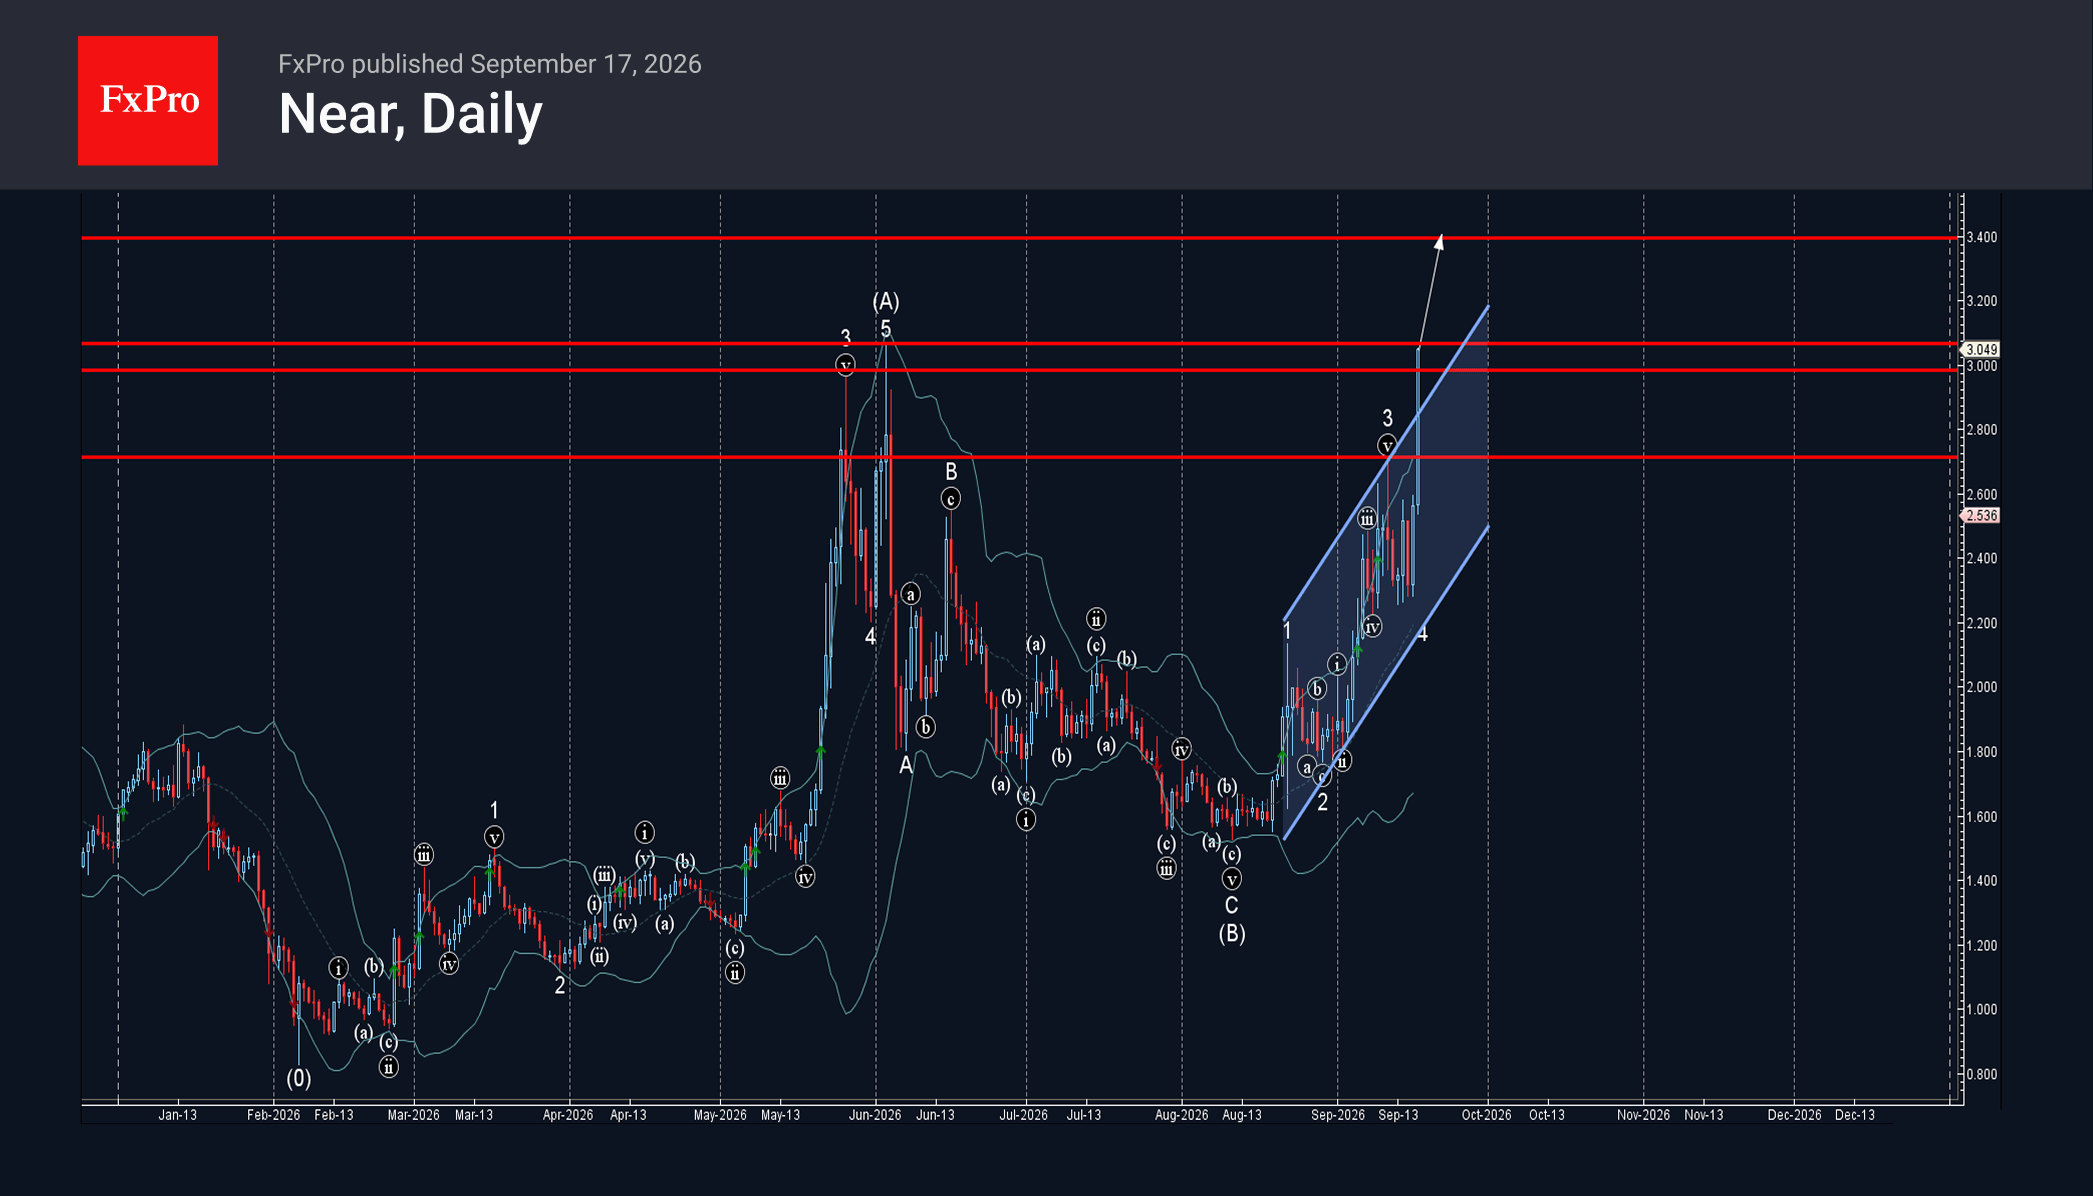
NEAR: ⬆️ Buy – NEAR broke resistance zone – Likely to rise to resistance level 3.40 NEAR cryptocurrency recently broke through the resistance zone between the resistance level 3.00 (which has been reversing the price from May) and the resistance.
September 16, 2026
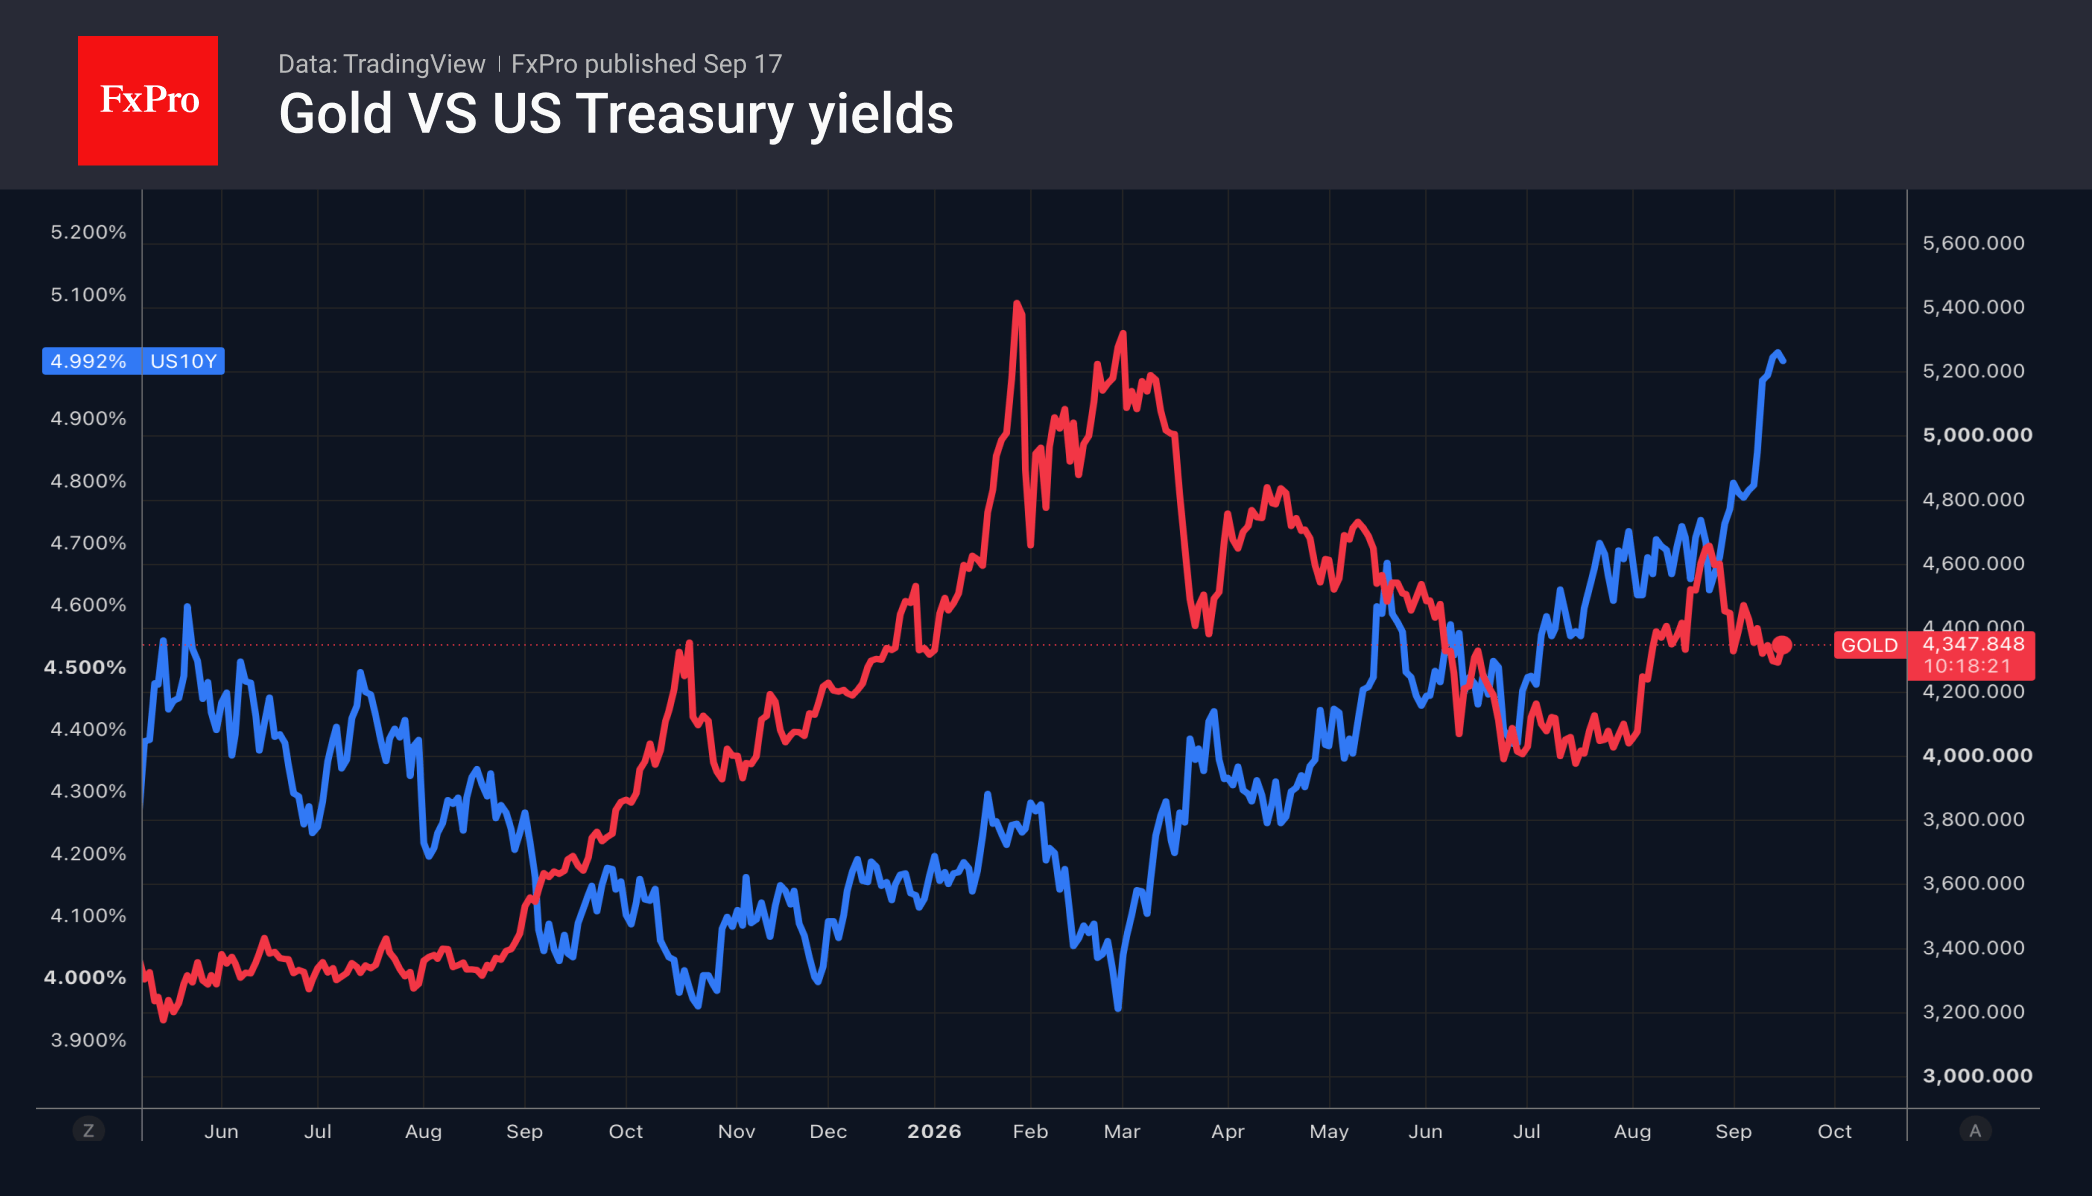
Gold is rising ahead of the Fed’s decision: the base case is favourable, but a hawkish outlook could trigger a sell-off and open up buying opportunities.