


Technical analysis - Page 5
September 30, 2026
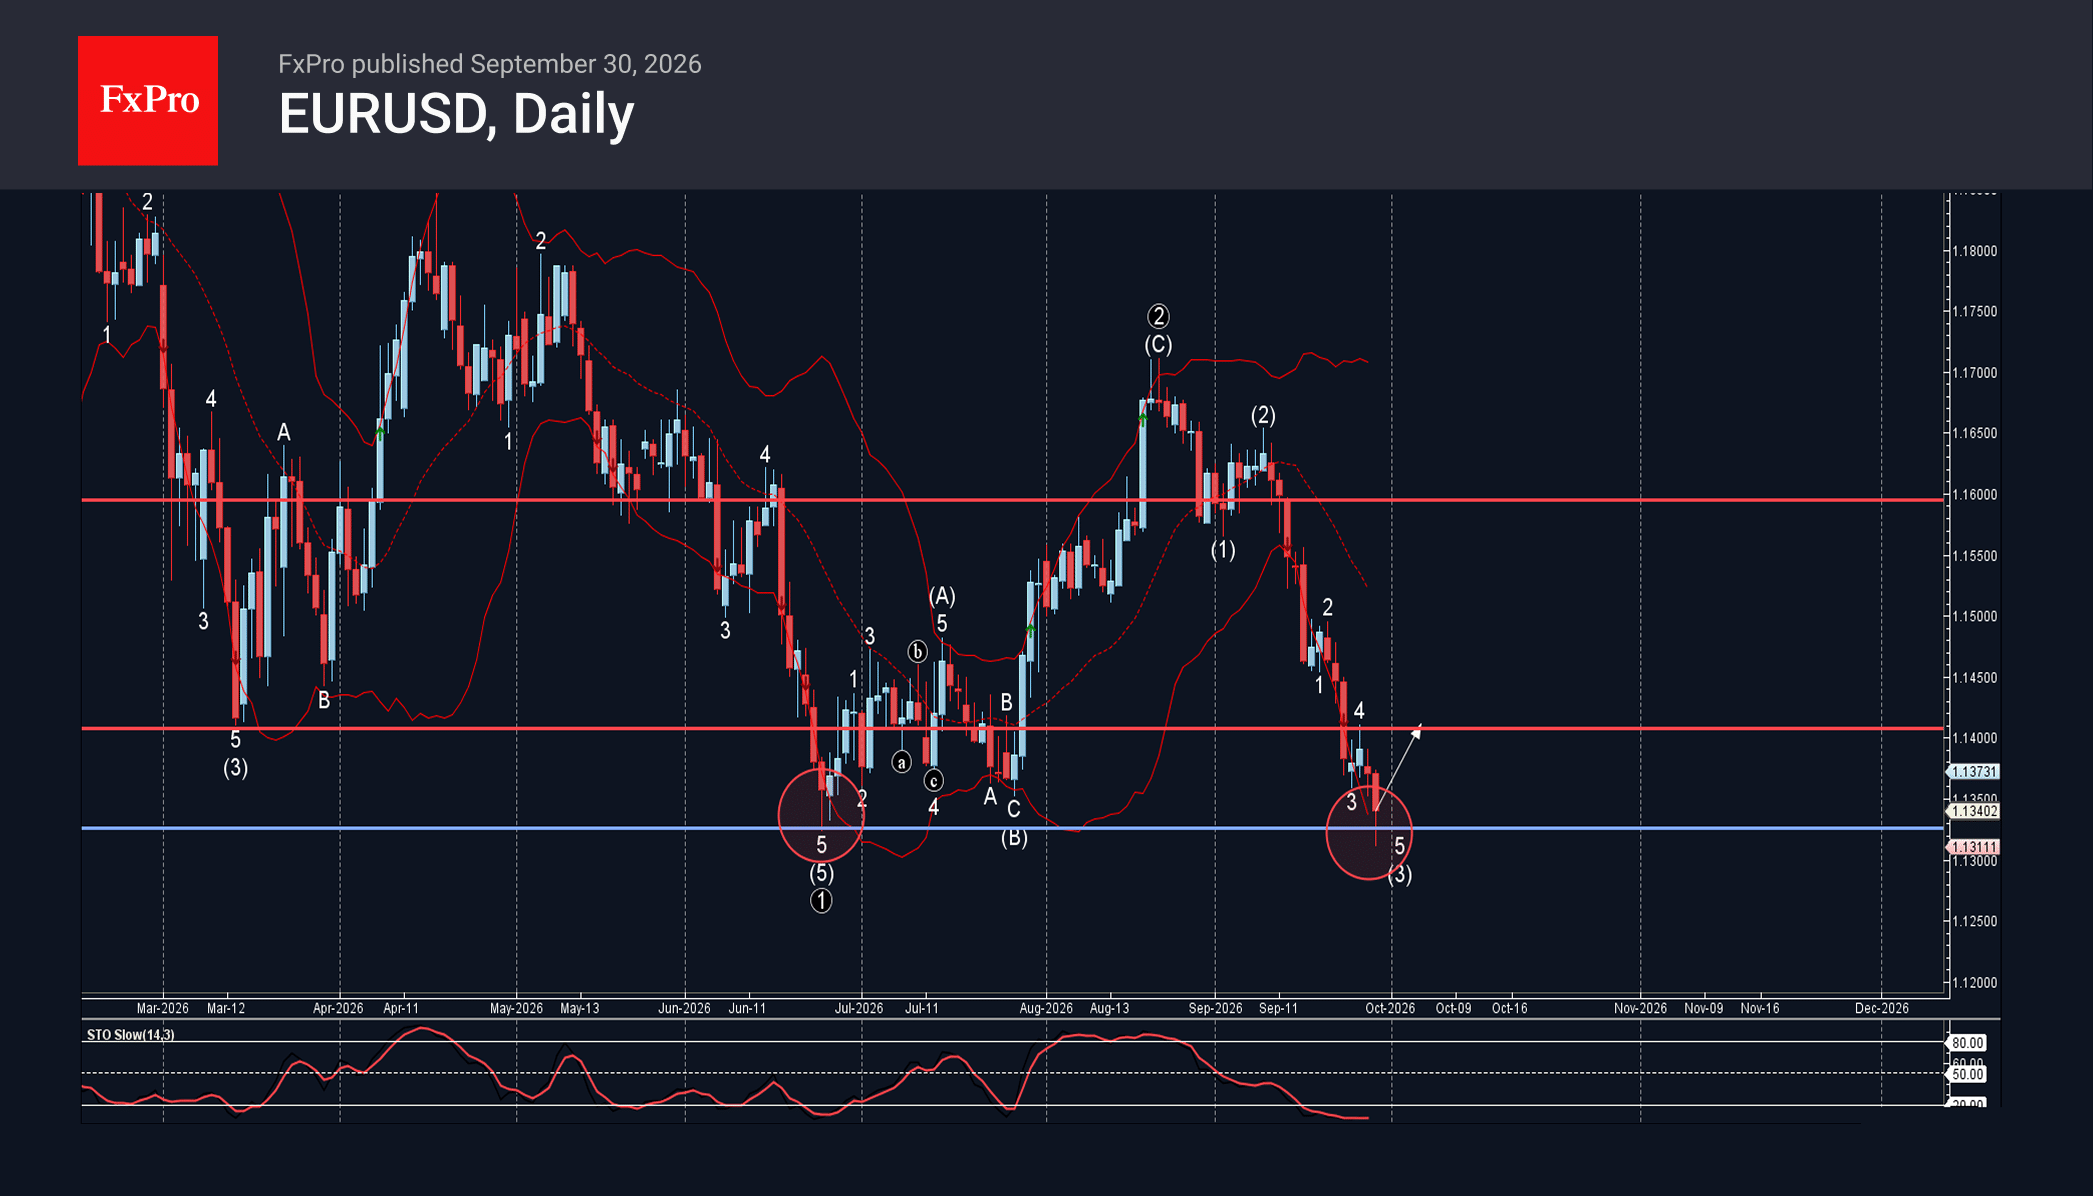
EURUSD: ⬆️ Buy – EURUSD reversed from support level 1.1300 – Likely to rise to resistance level 1.1400 EURUSD currency pair recently reversed up from the key support zone located between the support level 1.1300 (former multi-month low from July).
September 30, 2026
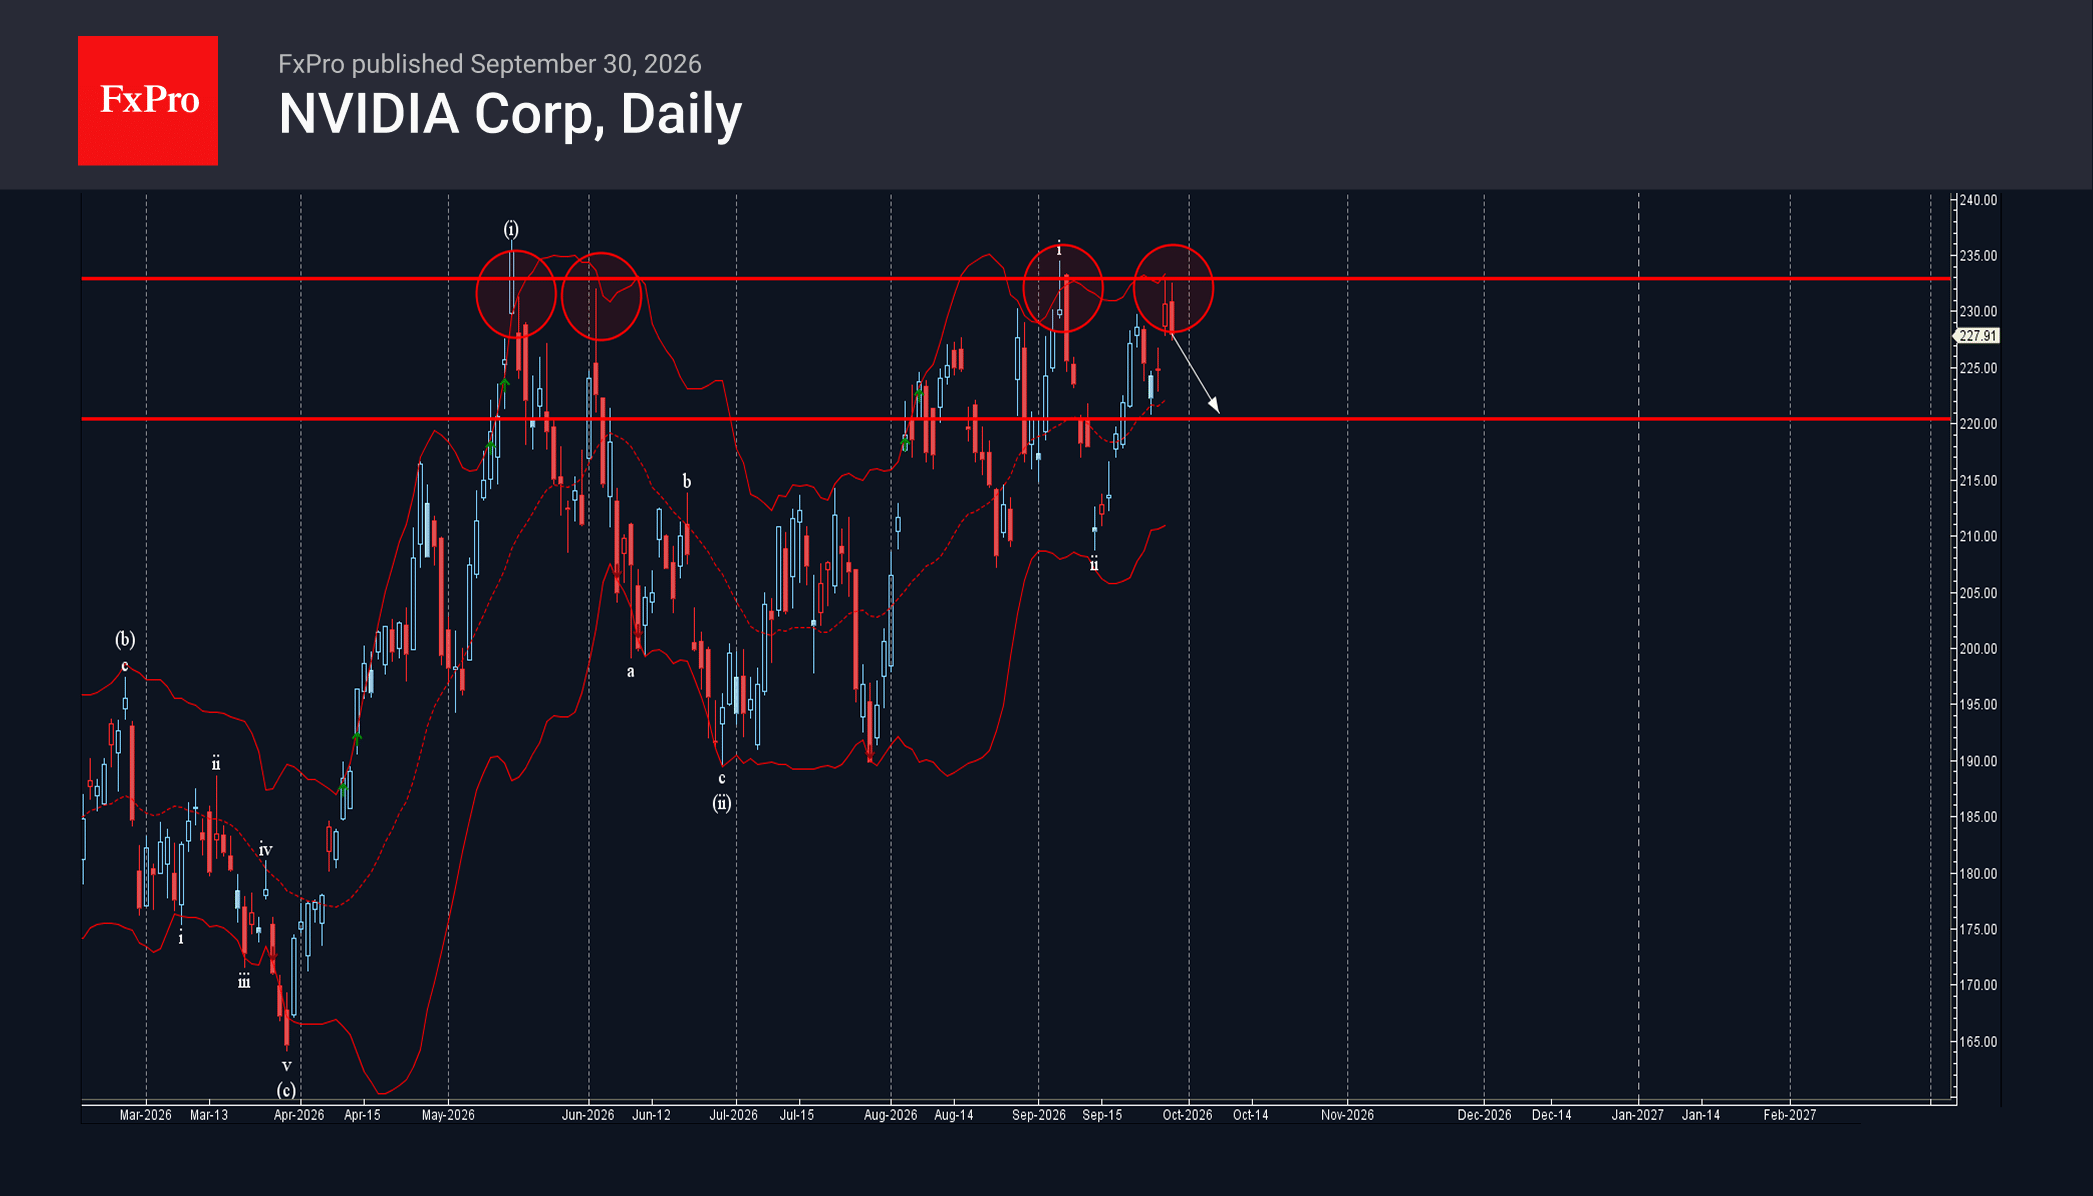
NVIDIA: ⬇️ Sell – NVIDIA reversed from resistance level 233.00 – Likely to fall to support level 220.00 NVIDIA (NVDA) stock recently reversed down from the key resistance level 233.00, which previously stopped sharp upward impulse in May, June, and.
September 30, 2026
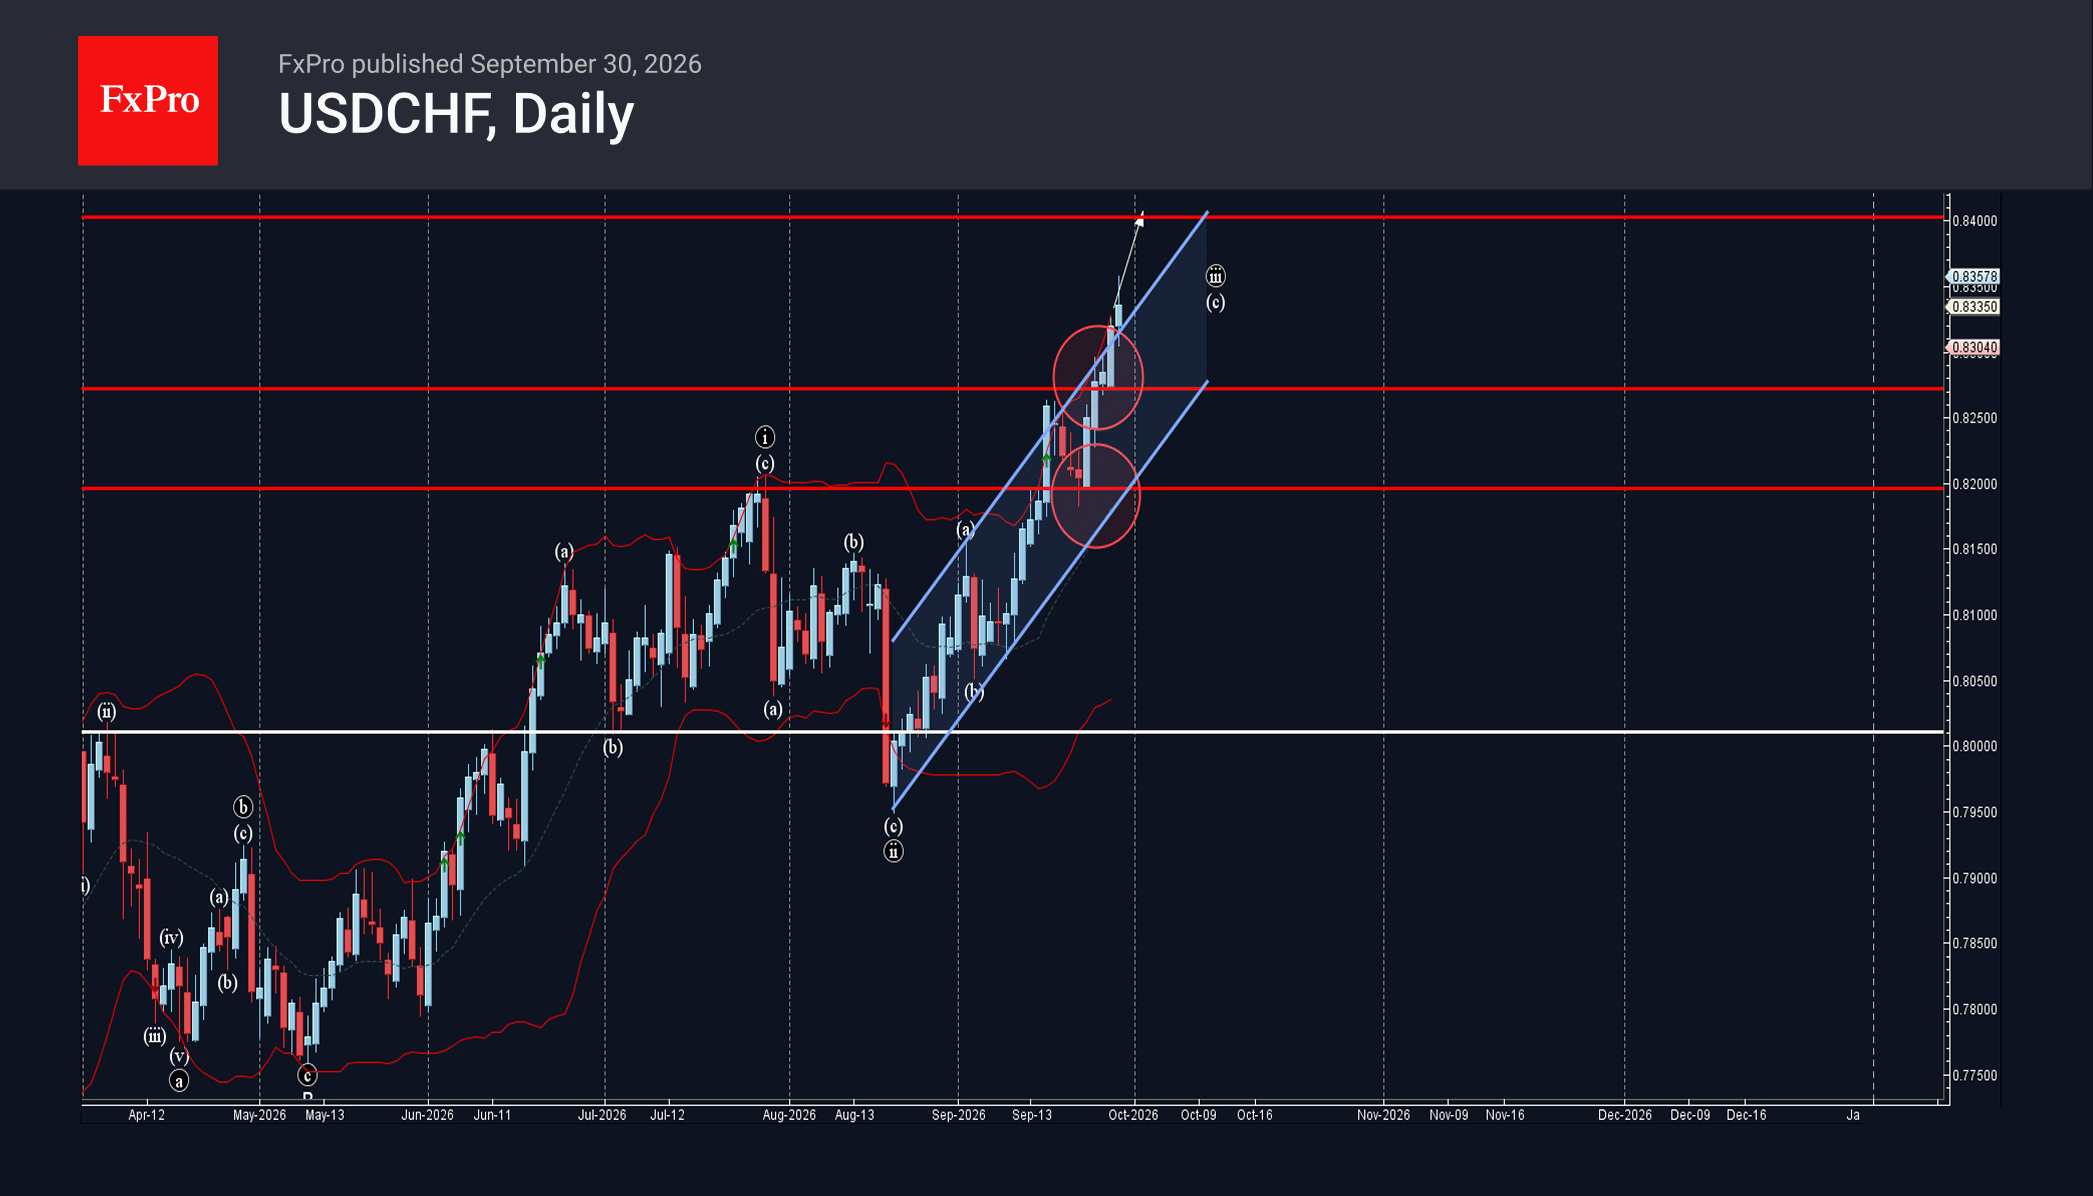
USDCHF: ⬆️ Buy – USDCHF broke key resistance level 0.8280 – Likely to rise to resistance level 0.8400 USDCHF currency pair recently broke through the key resistance level 0.8280, which previously stopped upward impulse in September and which intersects with.
September 29, 2026
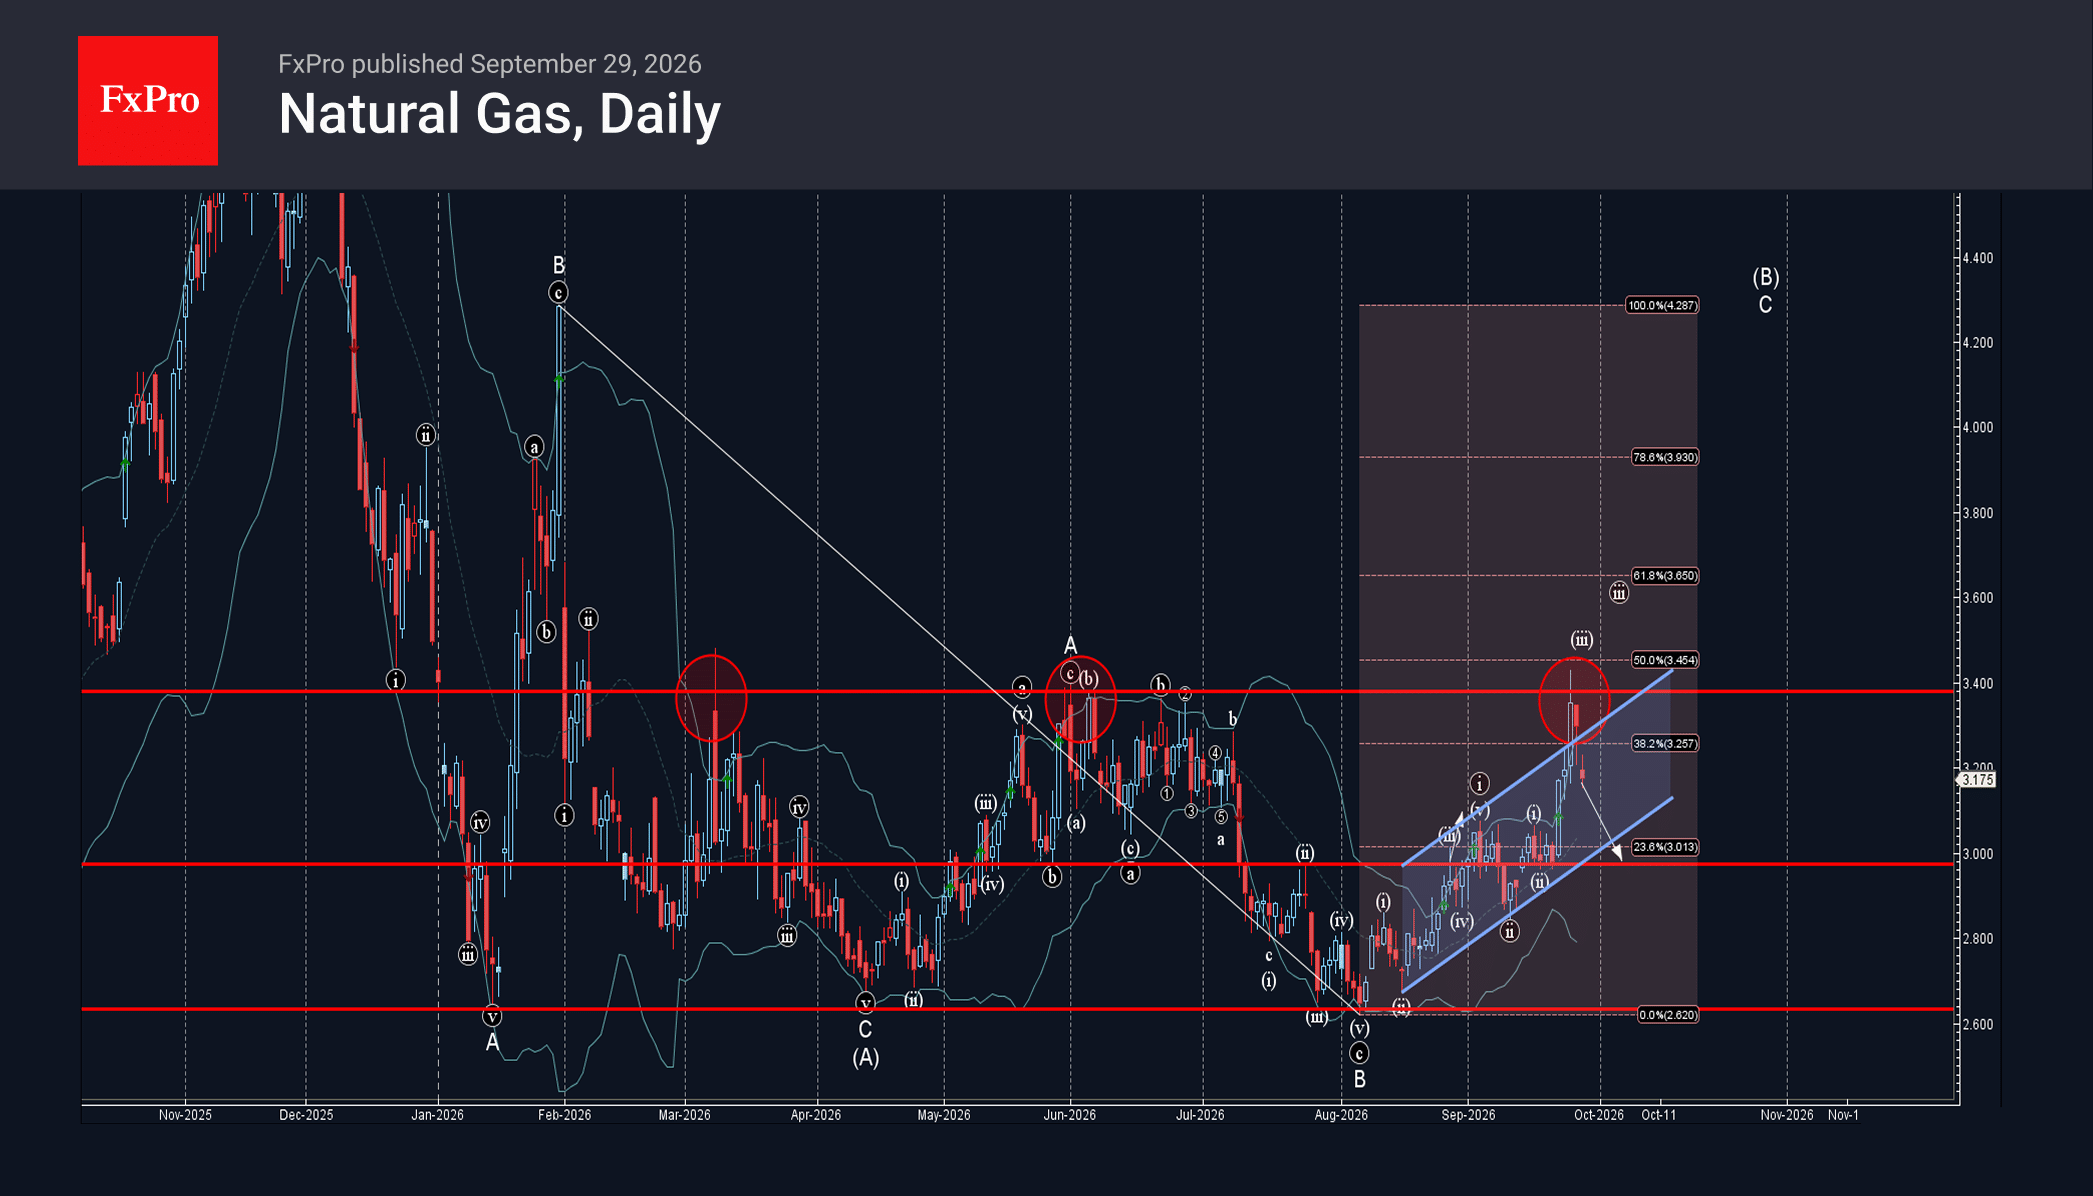
Natural Gas: ⬇️ Sell – Natural Gas reversed from resistance level 3.400 – Likely to fall to support level 3.000 Natural Gas recently reversed down from the resistance zone located at the intersection of the resistance level 3.400 (which previously.
September 29, 2026
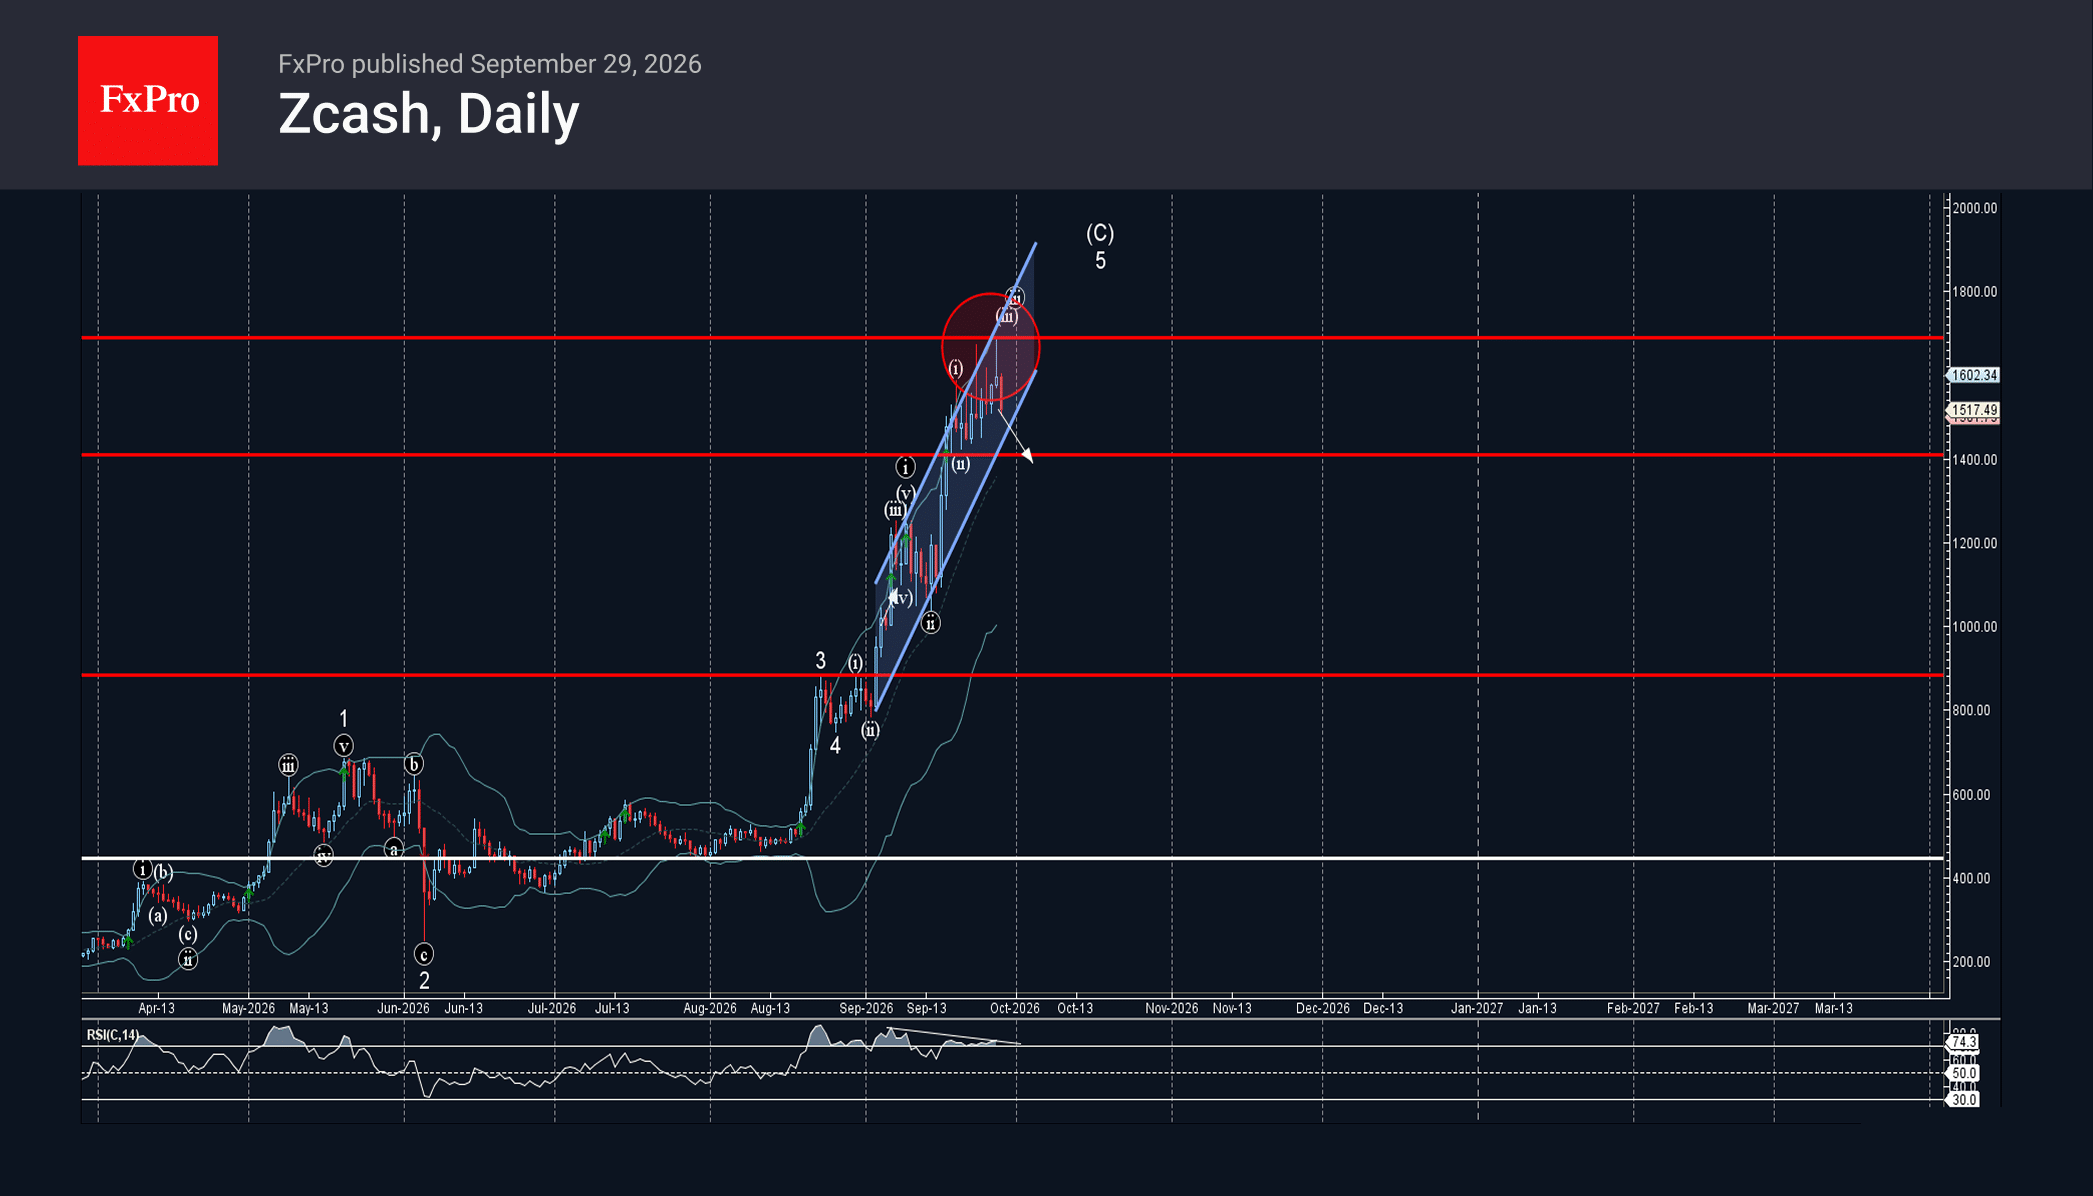
Zcash: ⬇️ Sell – Zcash reversed from resistance zone – Likely to fall to support level 1400.00 Zcash cryptocurrency recently reversed down from the resistance zone between the resistance level 1700.00 and the upper resistance trendline of the daily up.
September 28, 2026
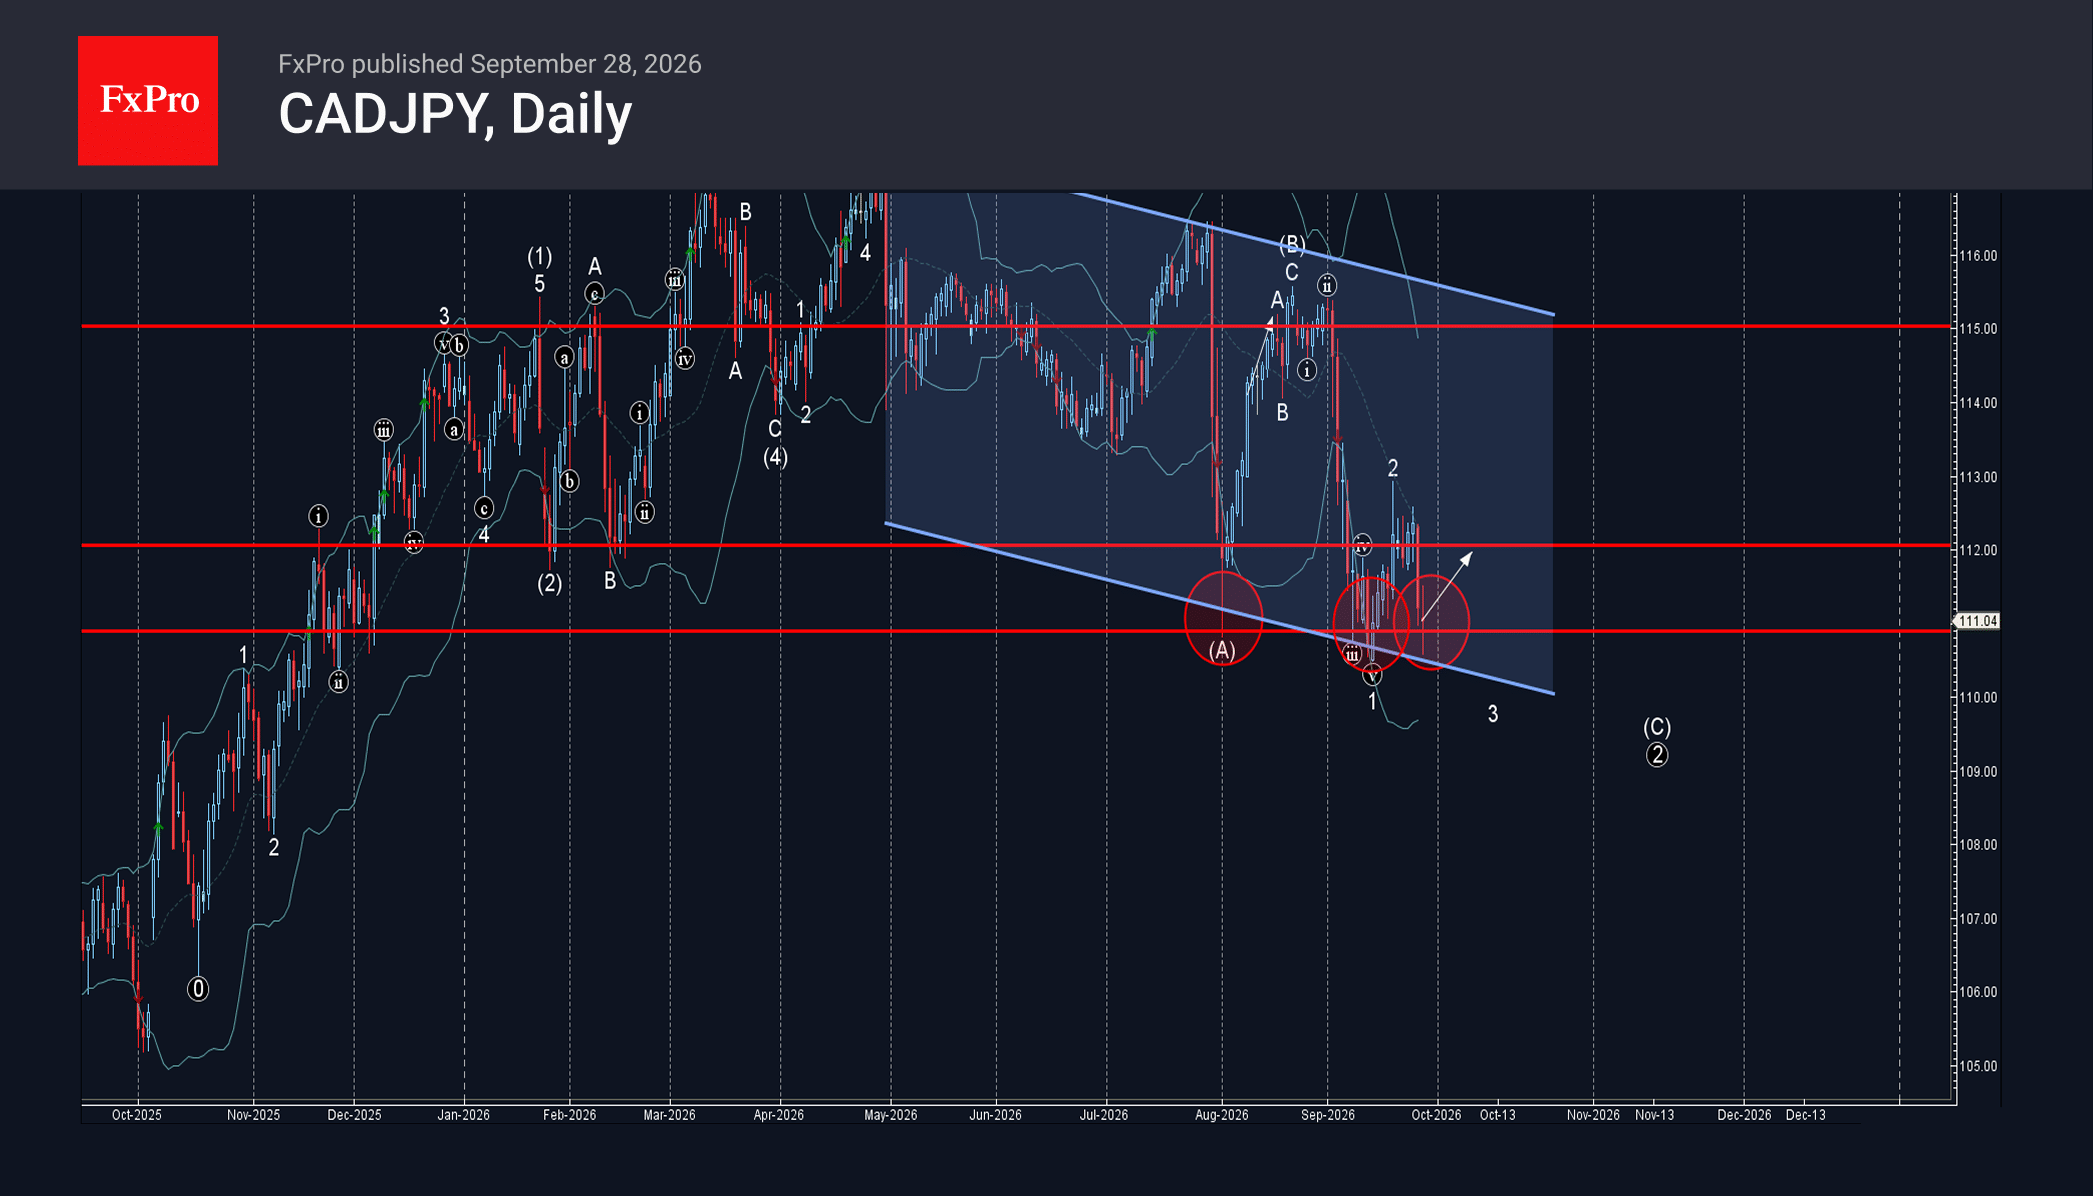
CADJPY: ⬆️ Buy – CADJPY reversed from support zone – Likely to rise to resistance level 112.00 CADJPY currency pair recently reversed up from the support zone located between the key support level 111.00 and the support trendline of the.
September 28, 2026
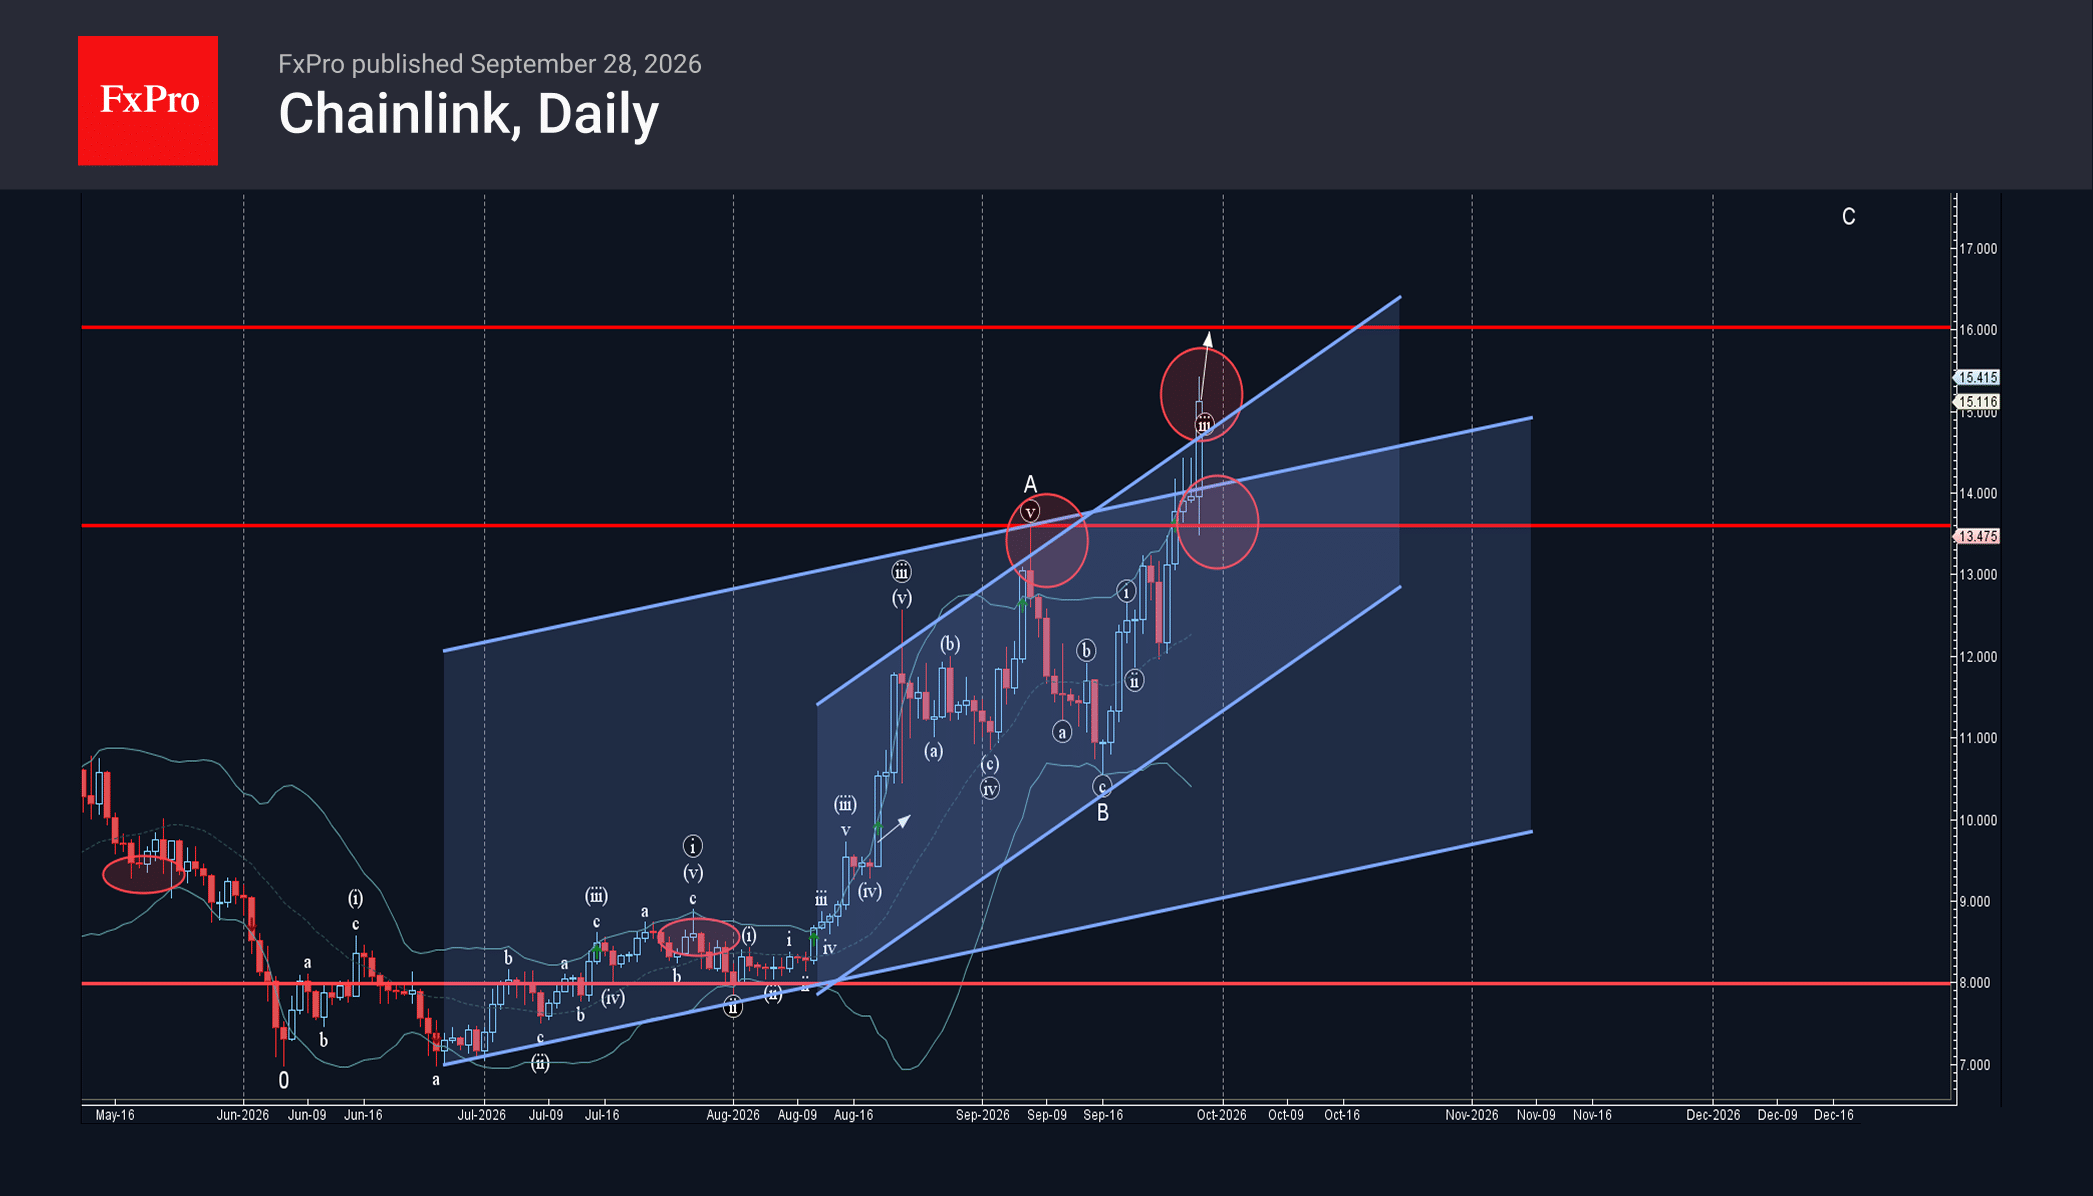
Chainlink: ⬆️ Buy – Chainlink broke key resistance level 13.475 – Likely to rise to resistance level 16.00 Chainlink cryptocurrency recently broke through the key resistance zone located between the resistance level 13.475 (which previously stopped the impulse wave A.
September 25, 2026
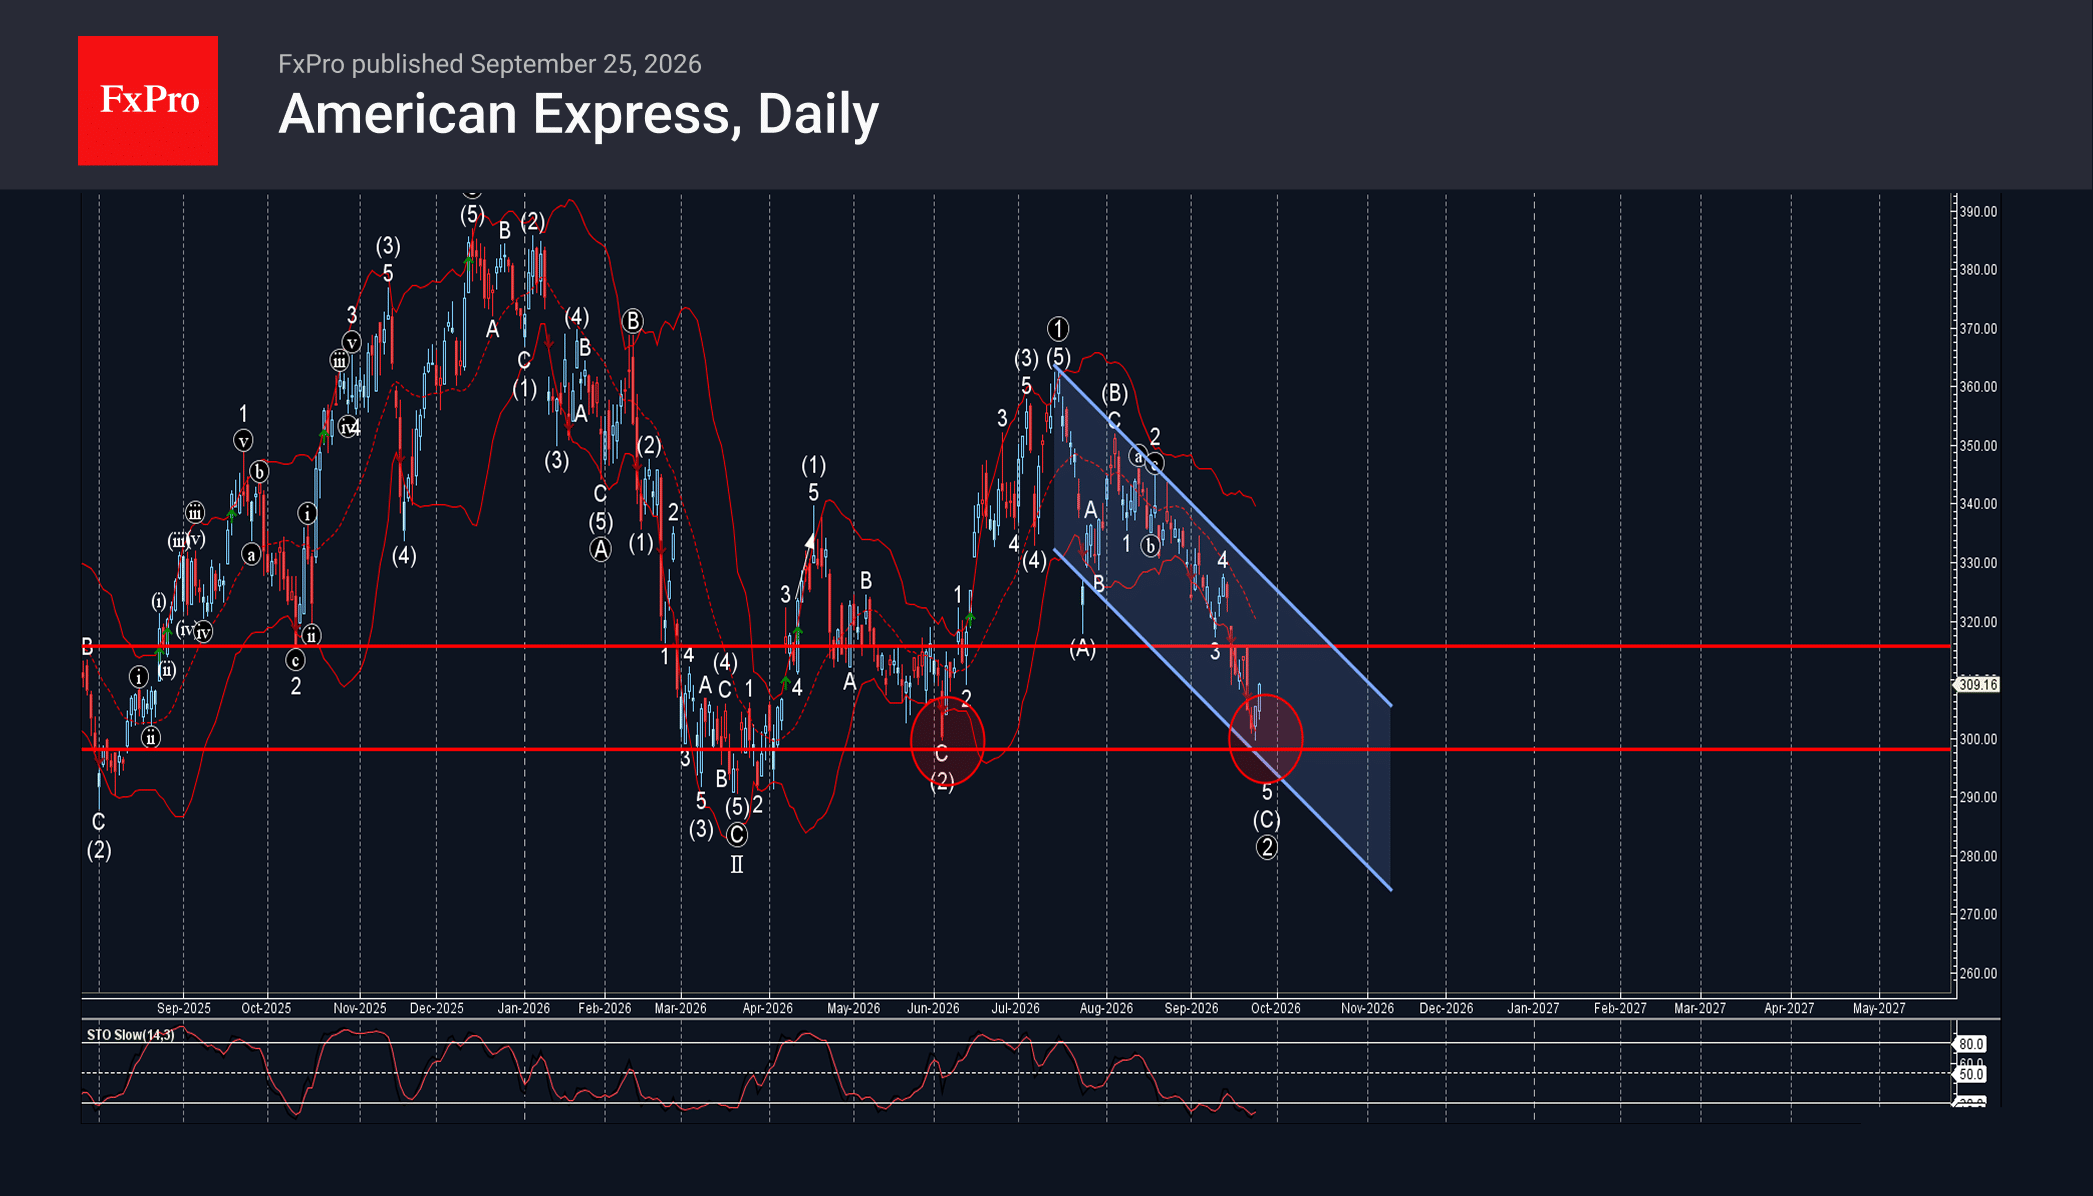
American Express: ⬆️ Buy – AXP reversed from support level 300.00 – Likely to rise to resistance level 315.75 American Express (AXP) stock recently reversed up from the support zone located between the key support level 300.00 (former multi-month low.
September 25, 2026
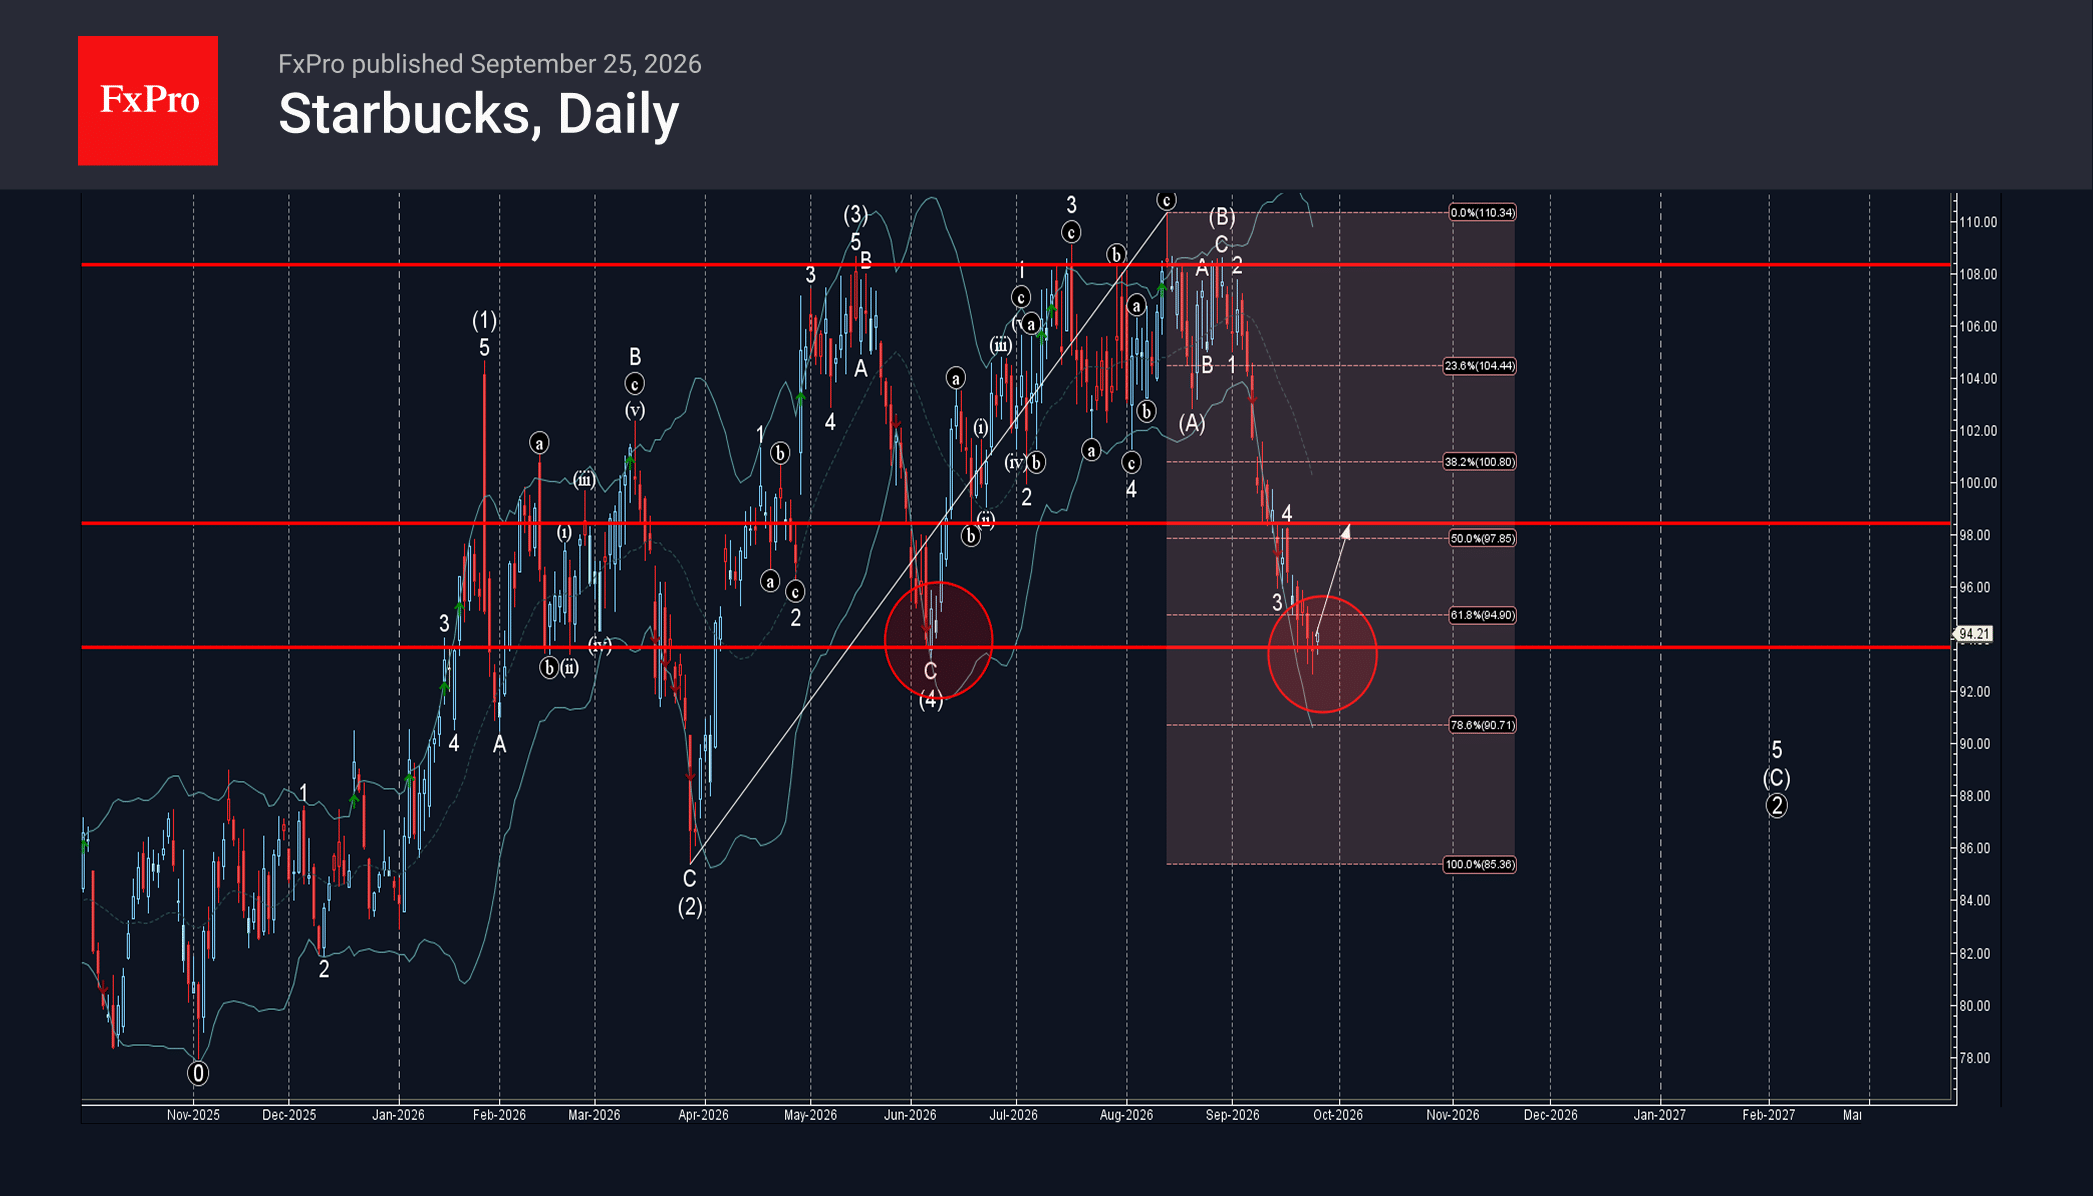
Starbucks : ⬆️ Buy – SBUX reversed from support zone – Likely to rise to resistance level 98.50 Starbucks (SBUX) stock recently reversed from the support zone located between the key support level 94.70 (which previously stopped the intermediate corrective.
September 25, 2026
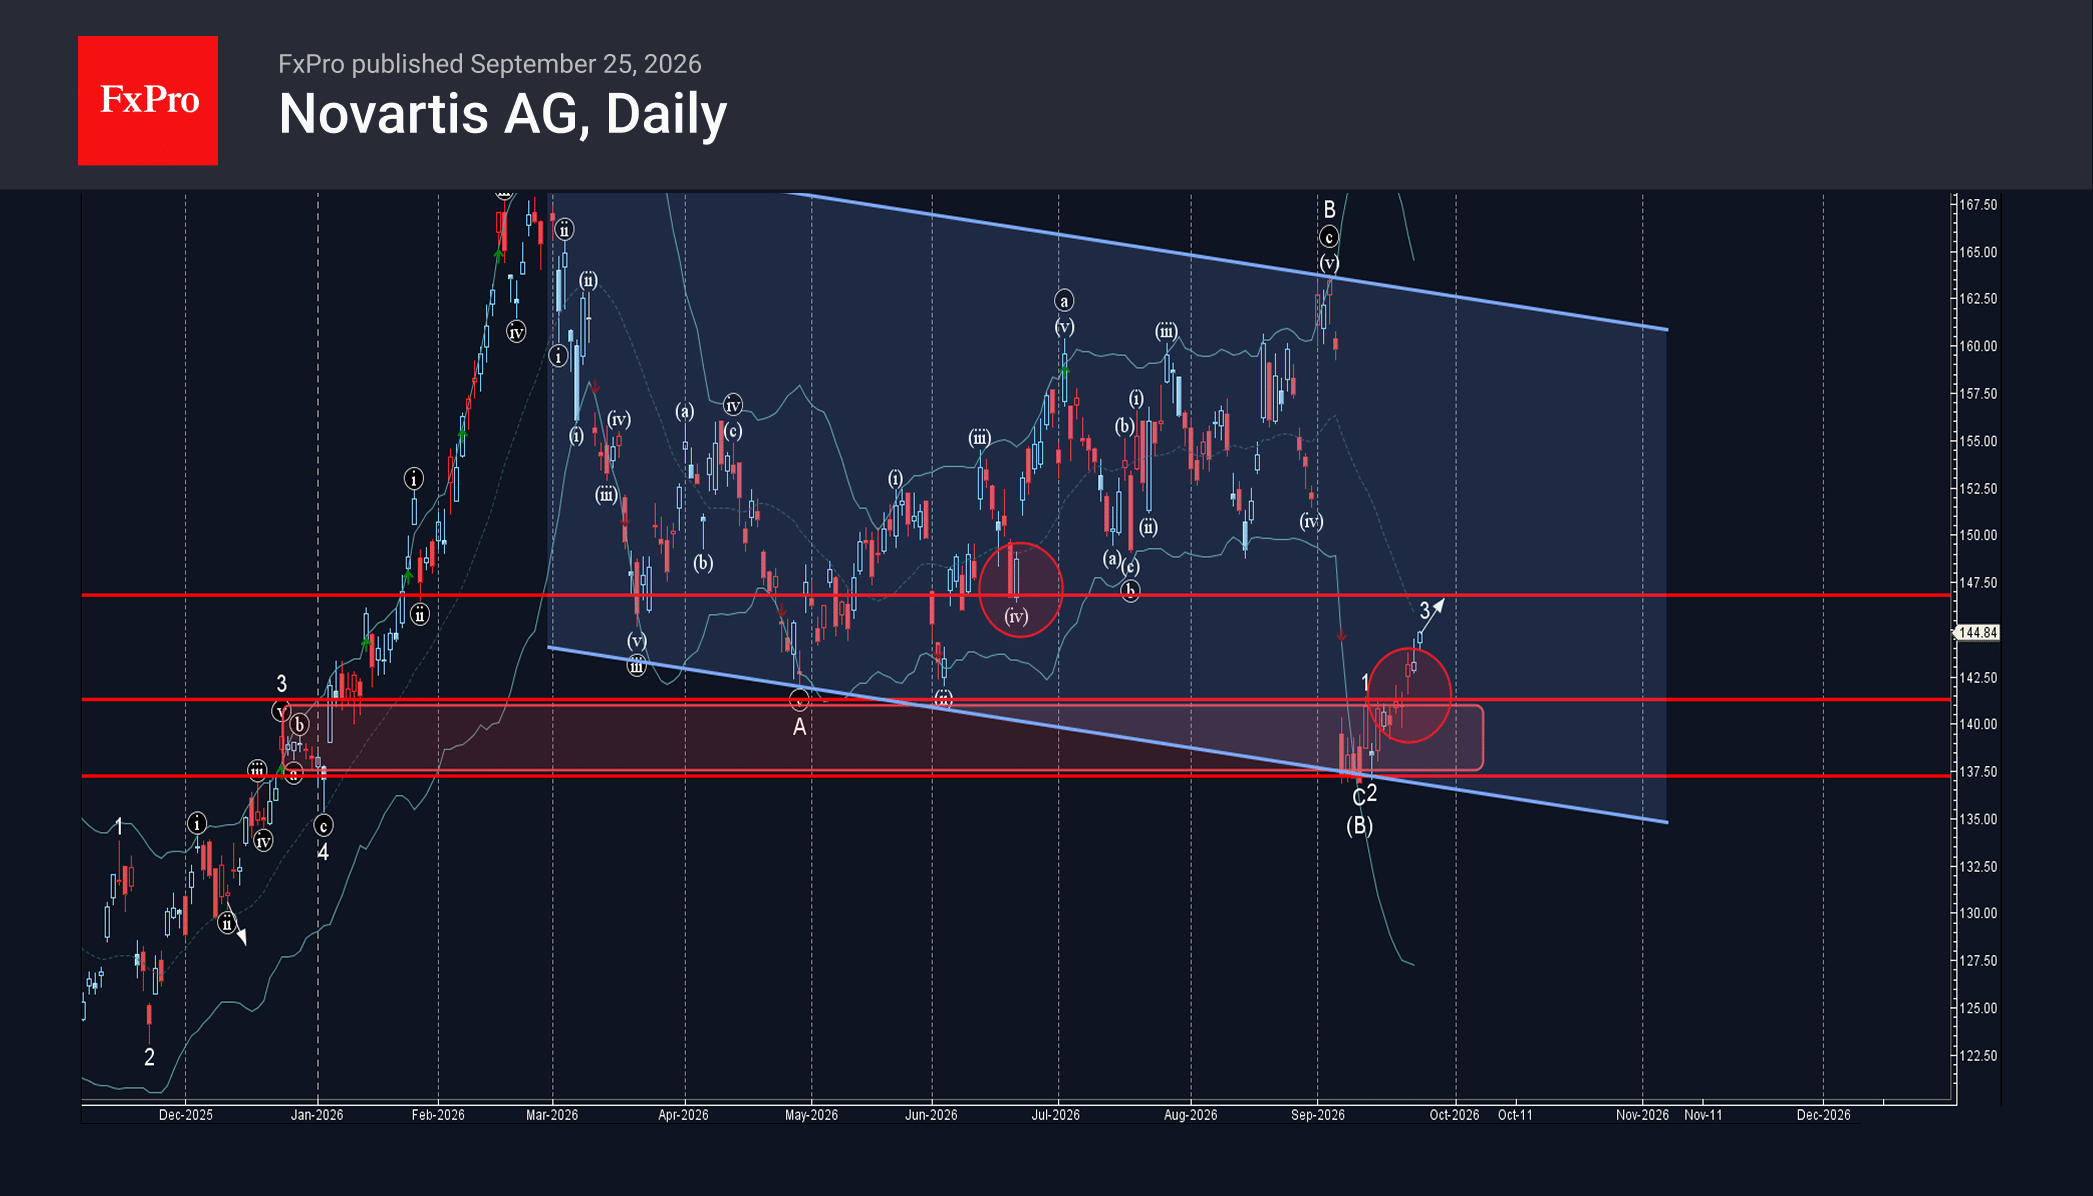
Novartis: ⬆️ Buy – Novartis reversed from support zone – Likely to rise to resistance level 147.50 Novartis recently reversed up from the support zone located between the key support level 137.50 (former support from January) and the lower support trendline of.
September 25, 2026
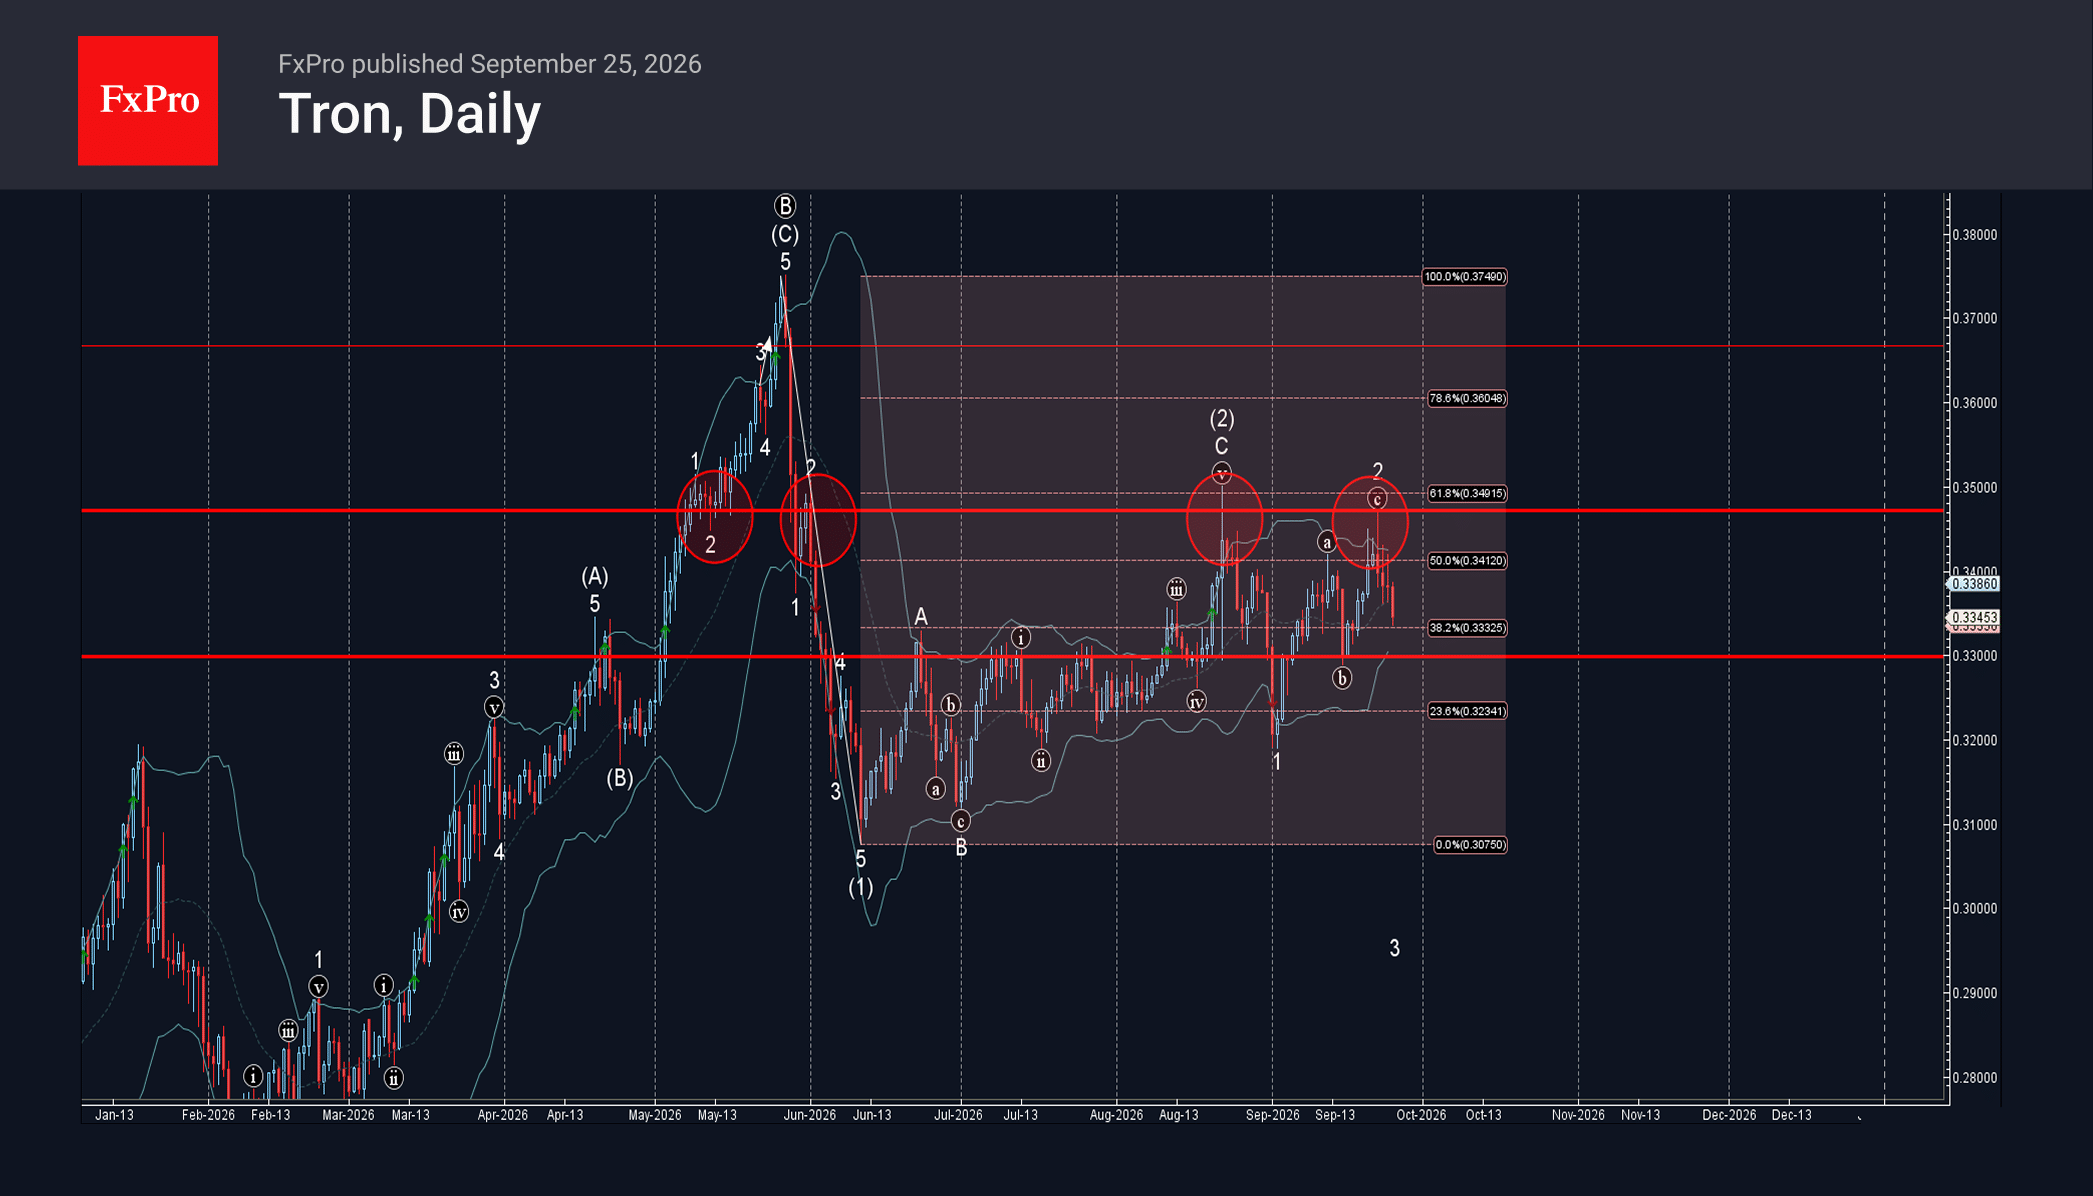
TRON: ⬇️ Sell – TRON reversed from resistance level 0.3470 – Likely to fall to support level 0.3300 TRON cryptocurrency recently reversed down from the key resistance level 0.3470, which coincided with the 61.8% Fibonacci correction level of the downward.
September 25, 2026
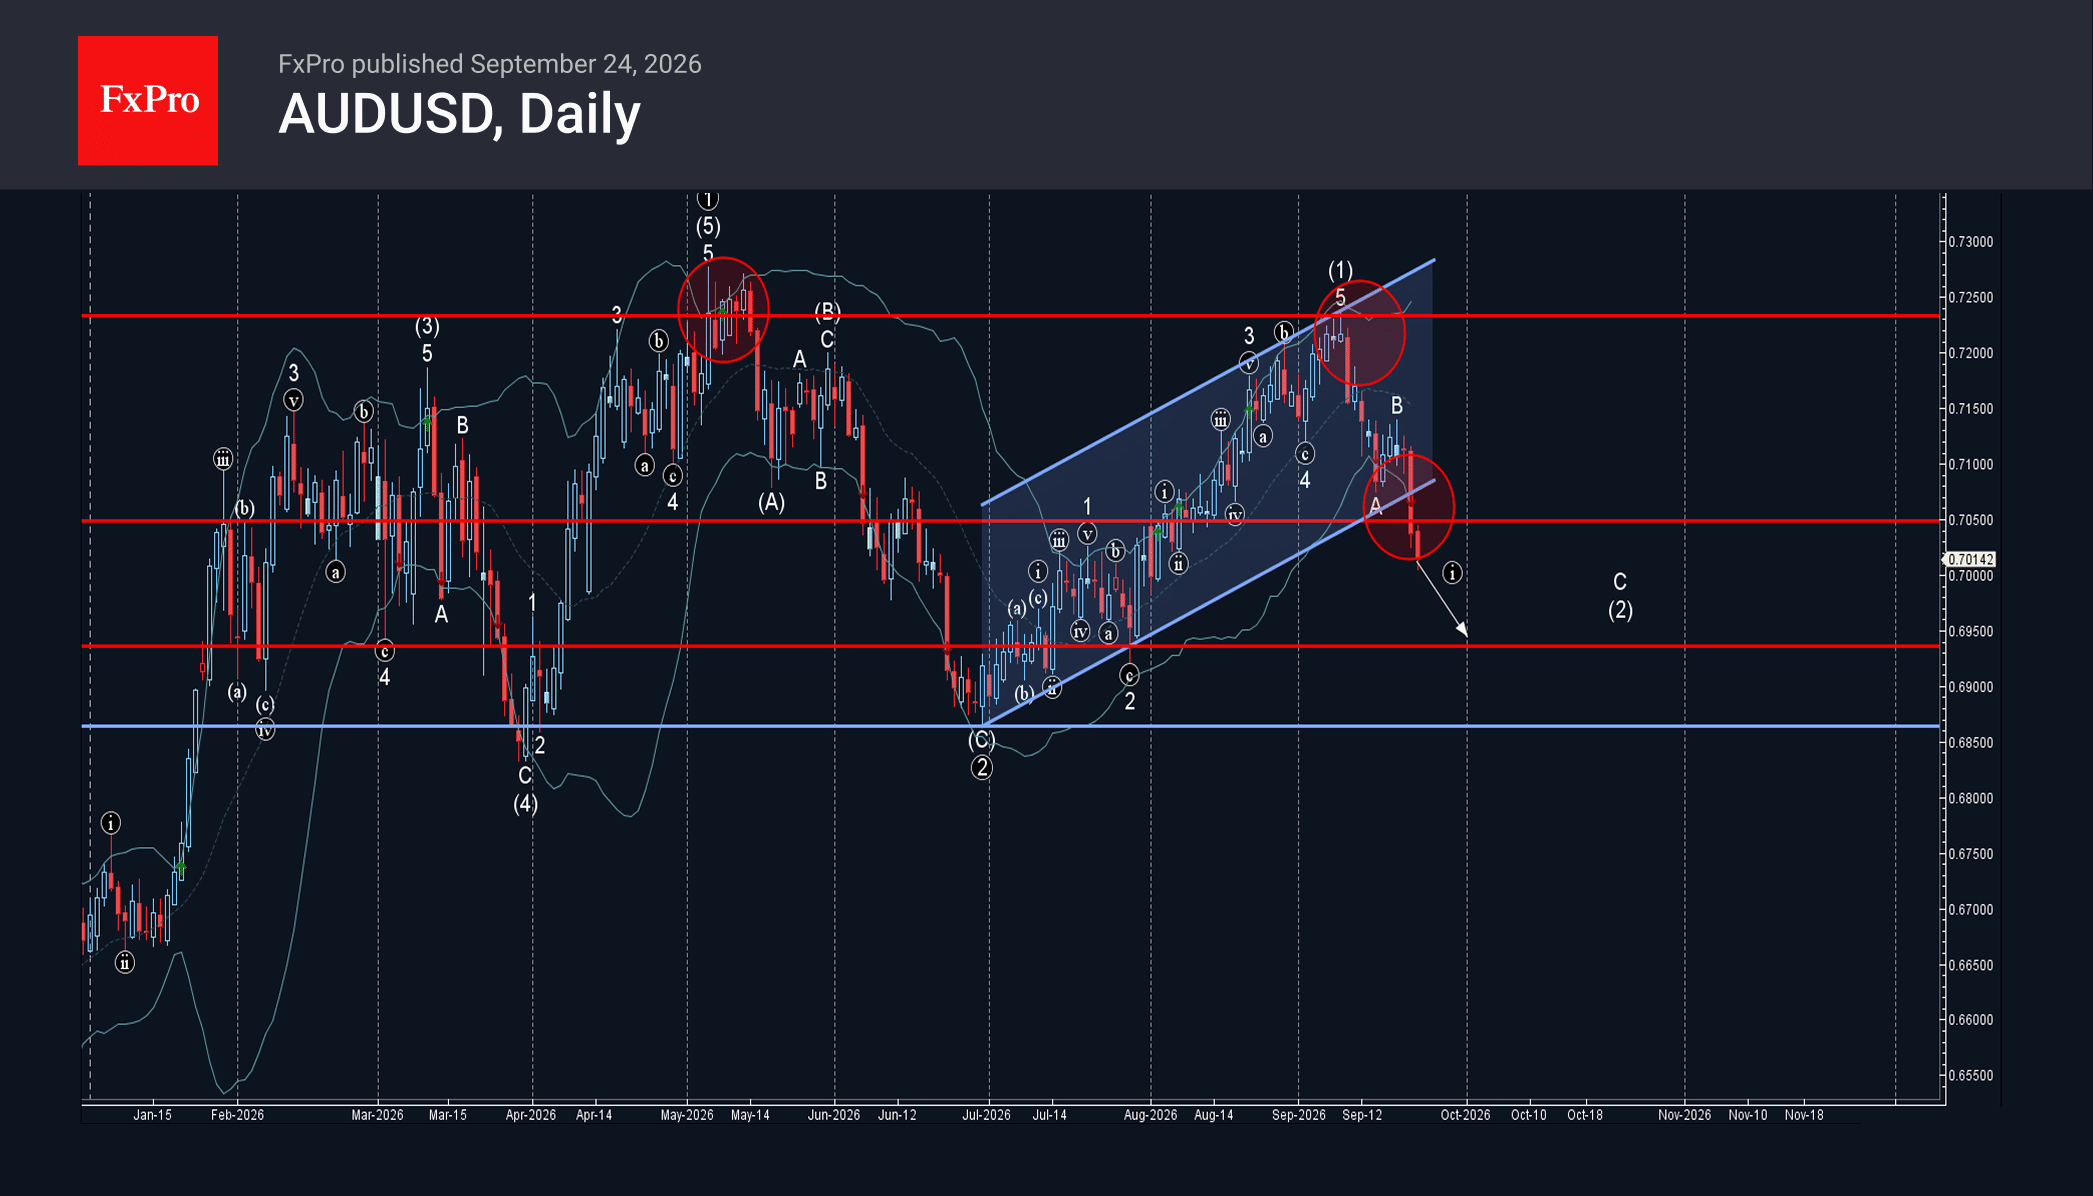
AUDUSD: ⬇️ Sell – AUDUSD broke key support level 0.7050 – Likely to fall to support level 0.6940 AUDUSD currency pair recently reversed down from the key resistance zone located between the resistance zone 0.7235 (which previously stopped the major.