October 26, 2026 Market Overview
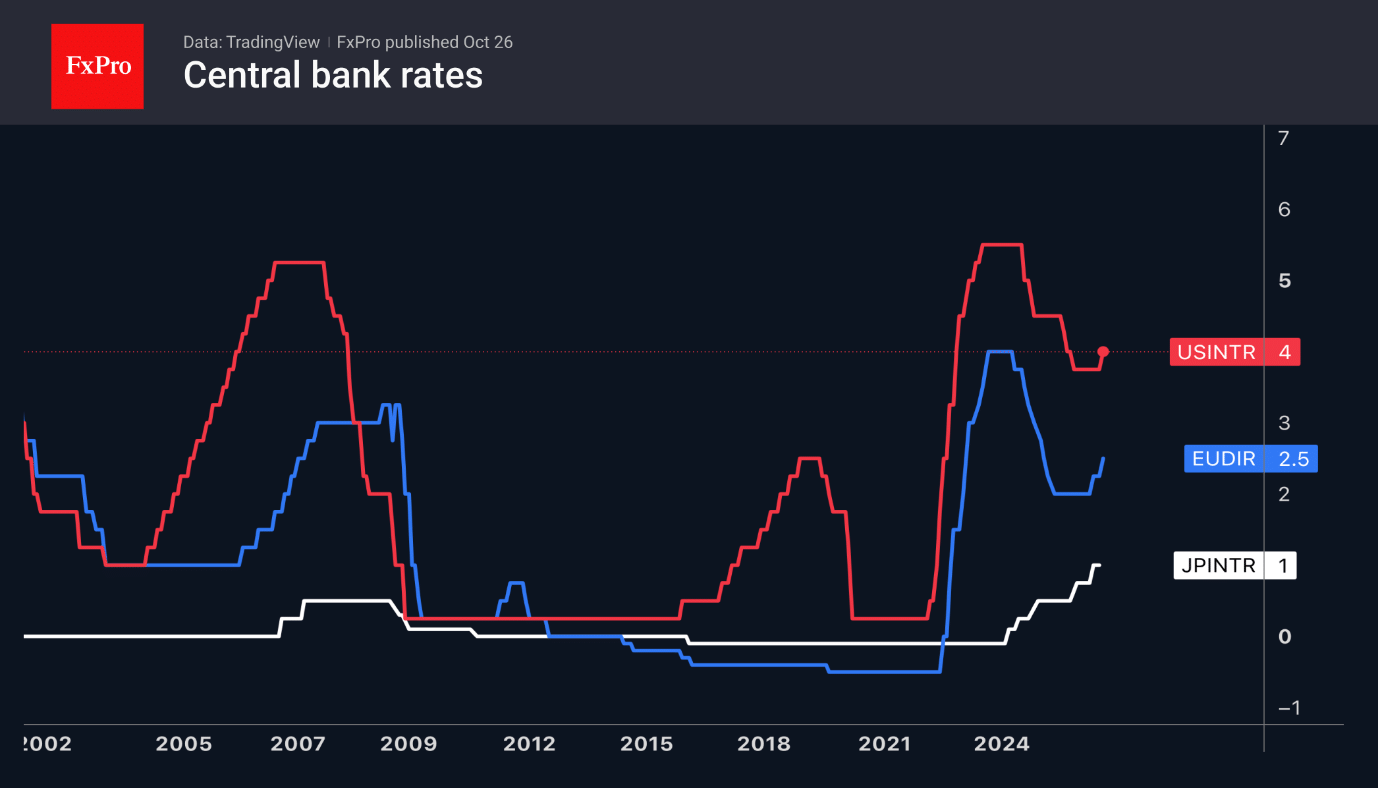
The Fed, ECB and BoJ are expected to hold rates, keeping the dollar near highs. EURUSD is steadied by Moody’s decision to keep France's rating.
October 26, 2026 Crypto Review
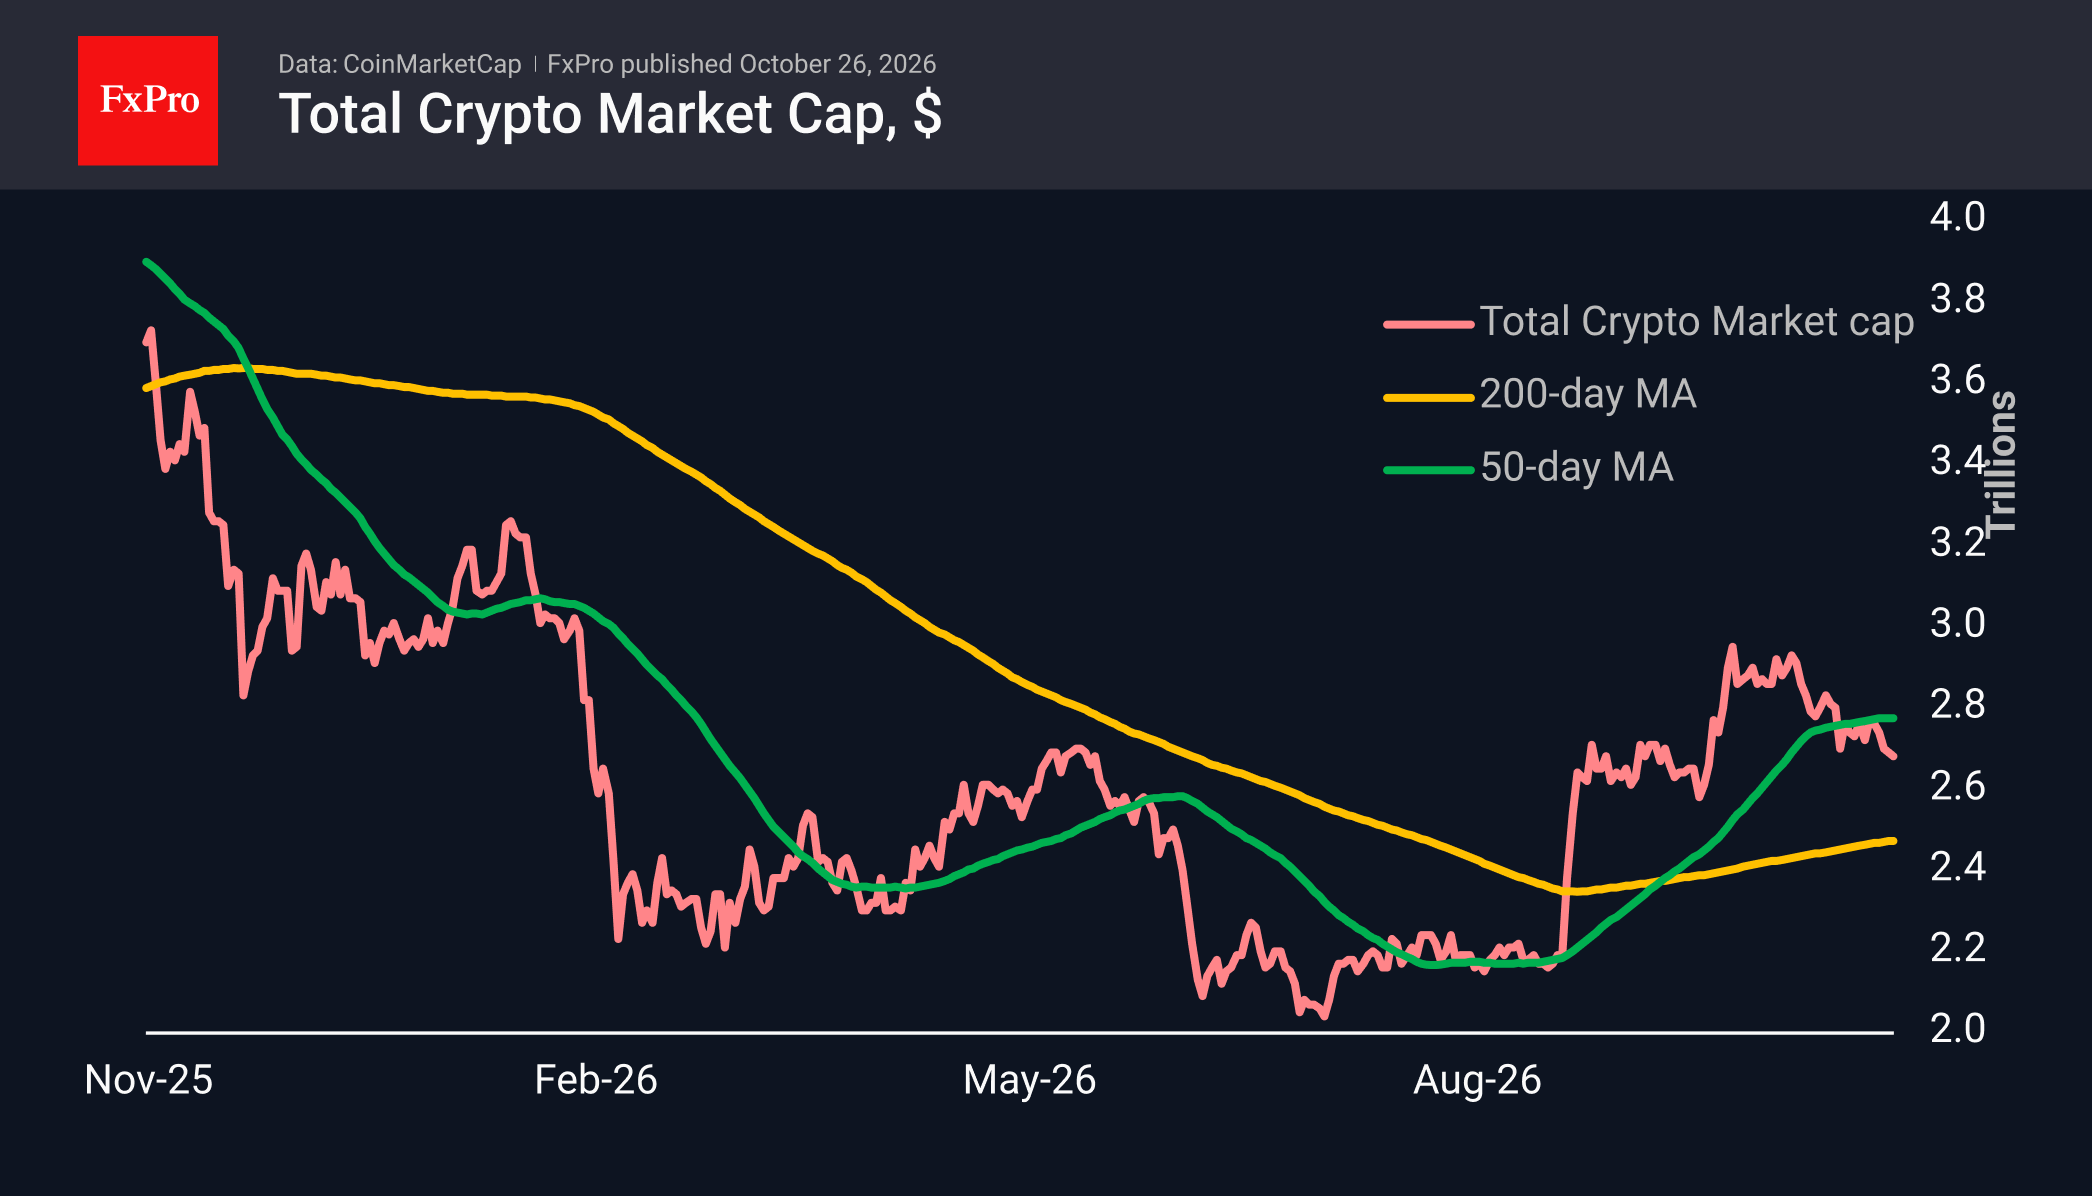
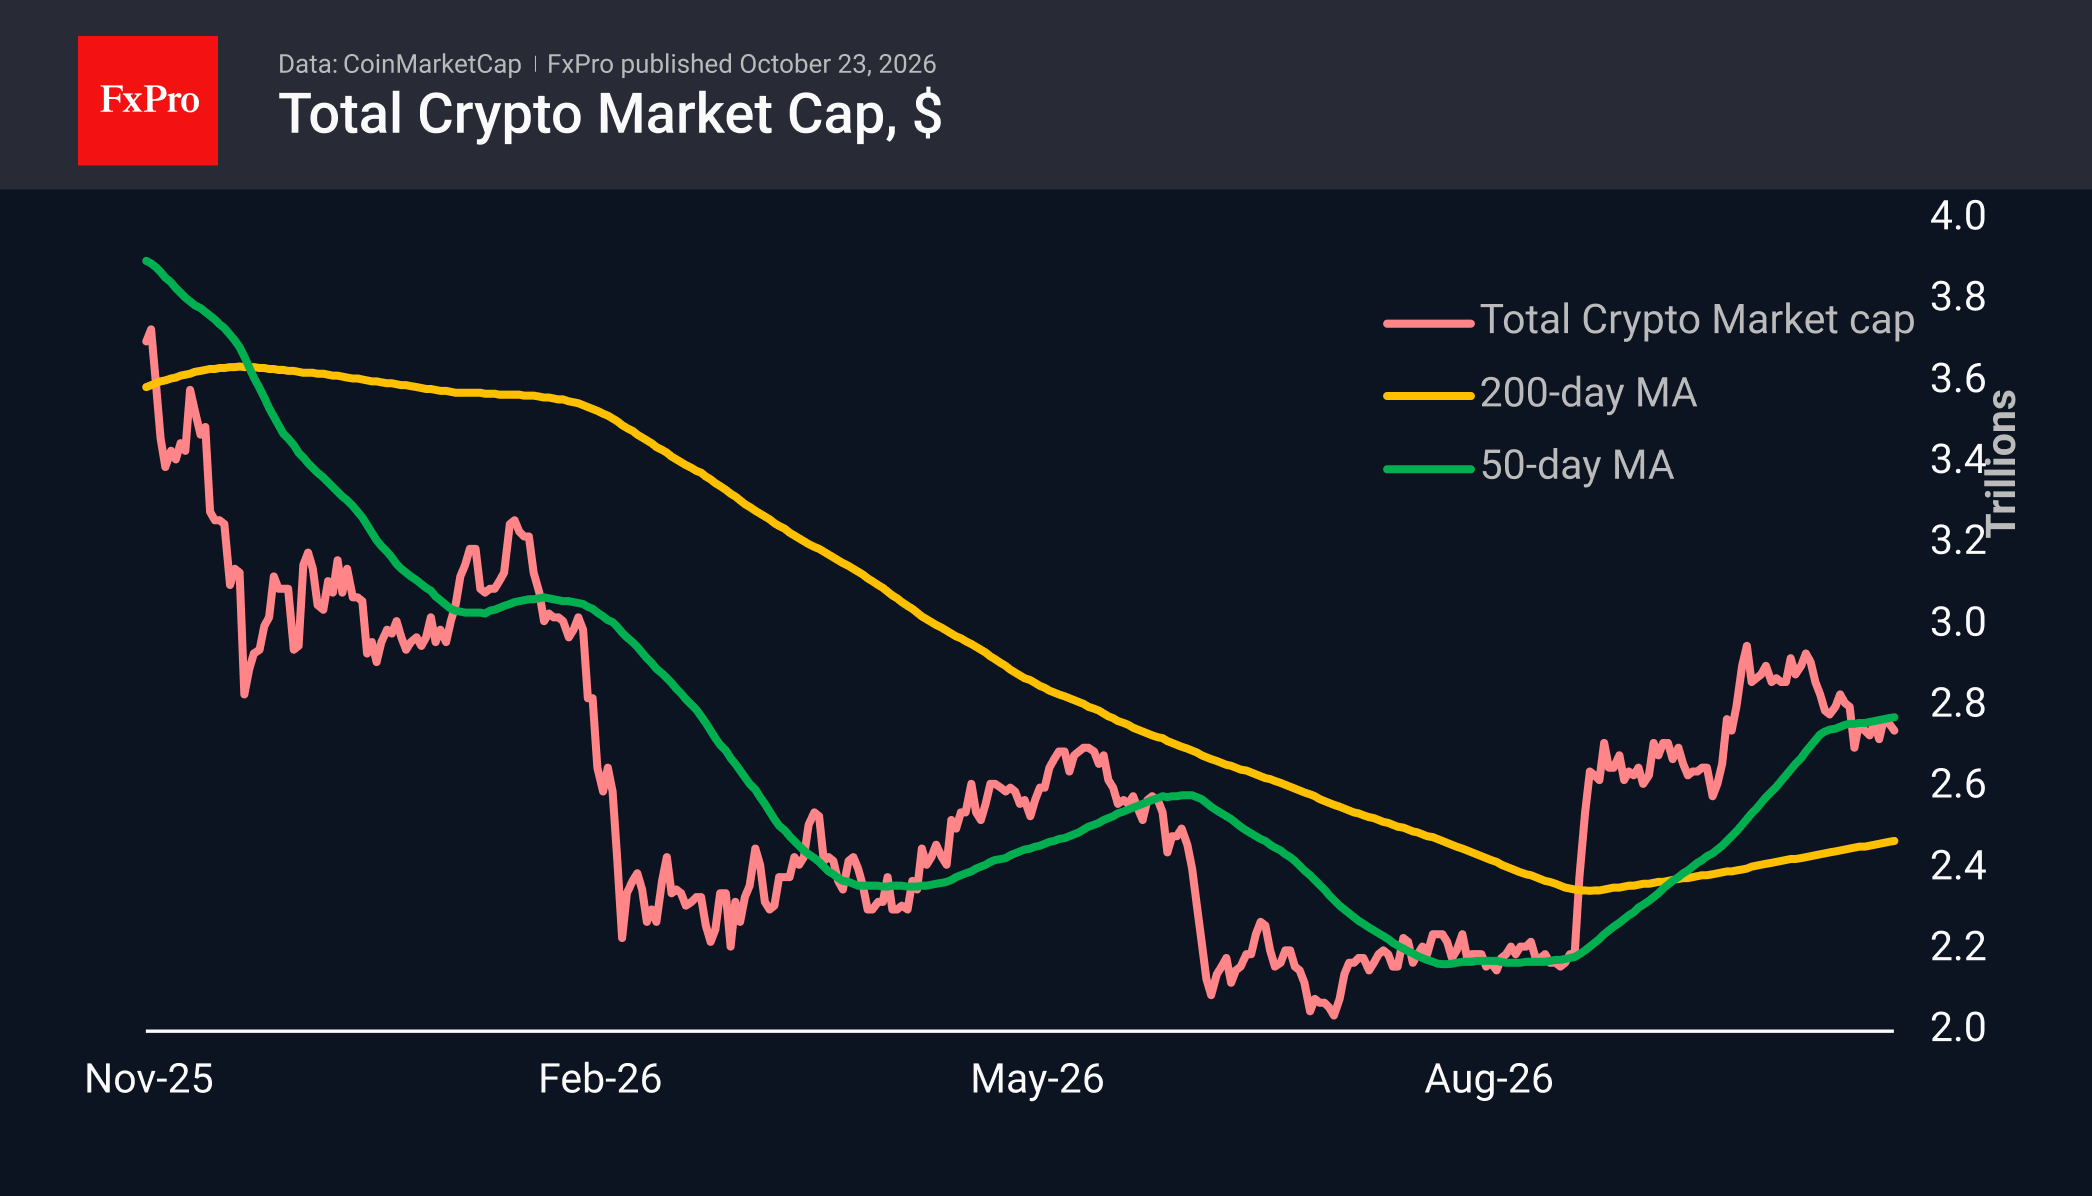
Crypto market drifts lower with a market cap of $2.67T. Bitcoin is below $80.0K, with a pullback to $75K likely. Bitcoin ETF inflows resumed, but sentiment is cooling.
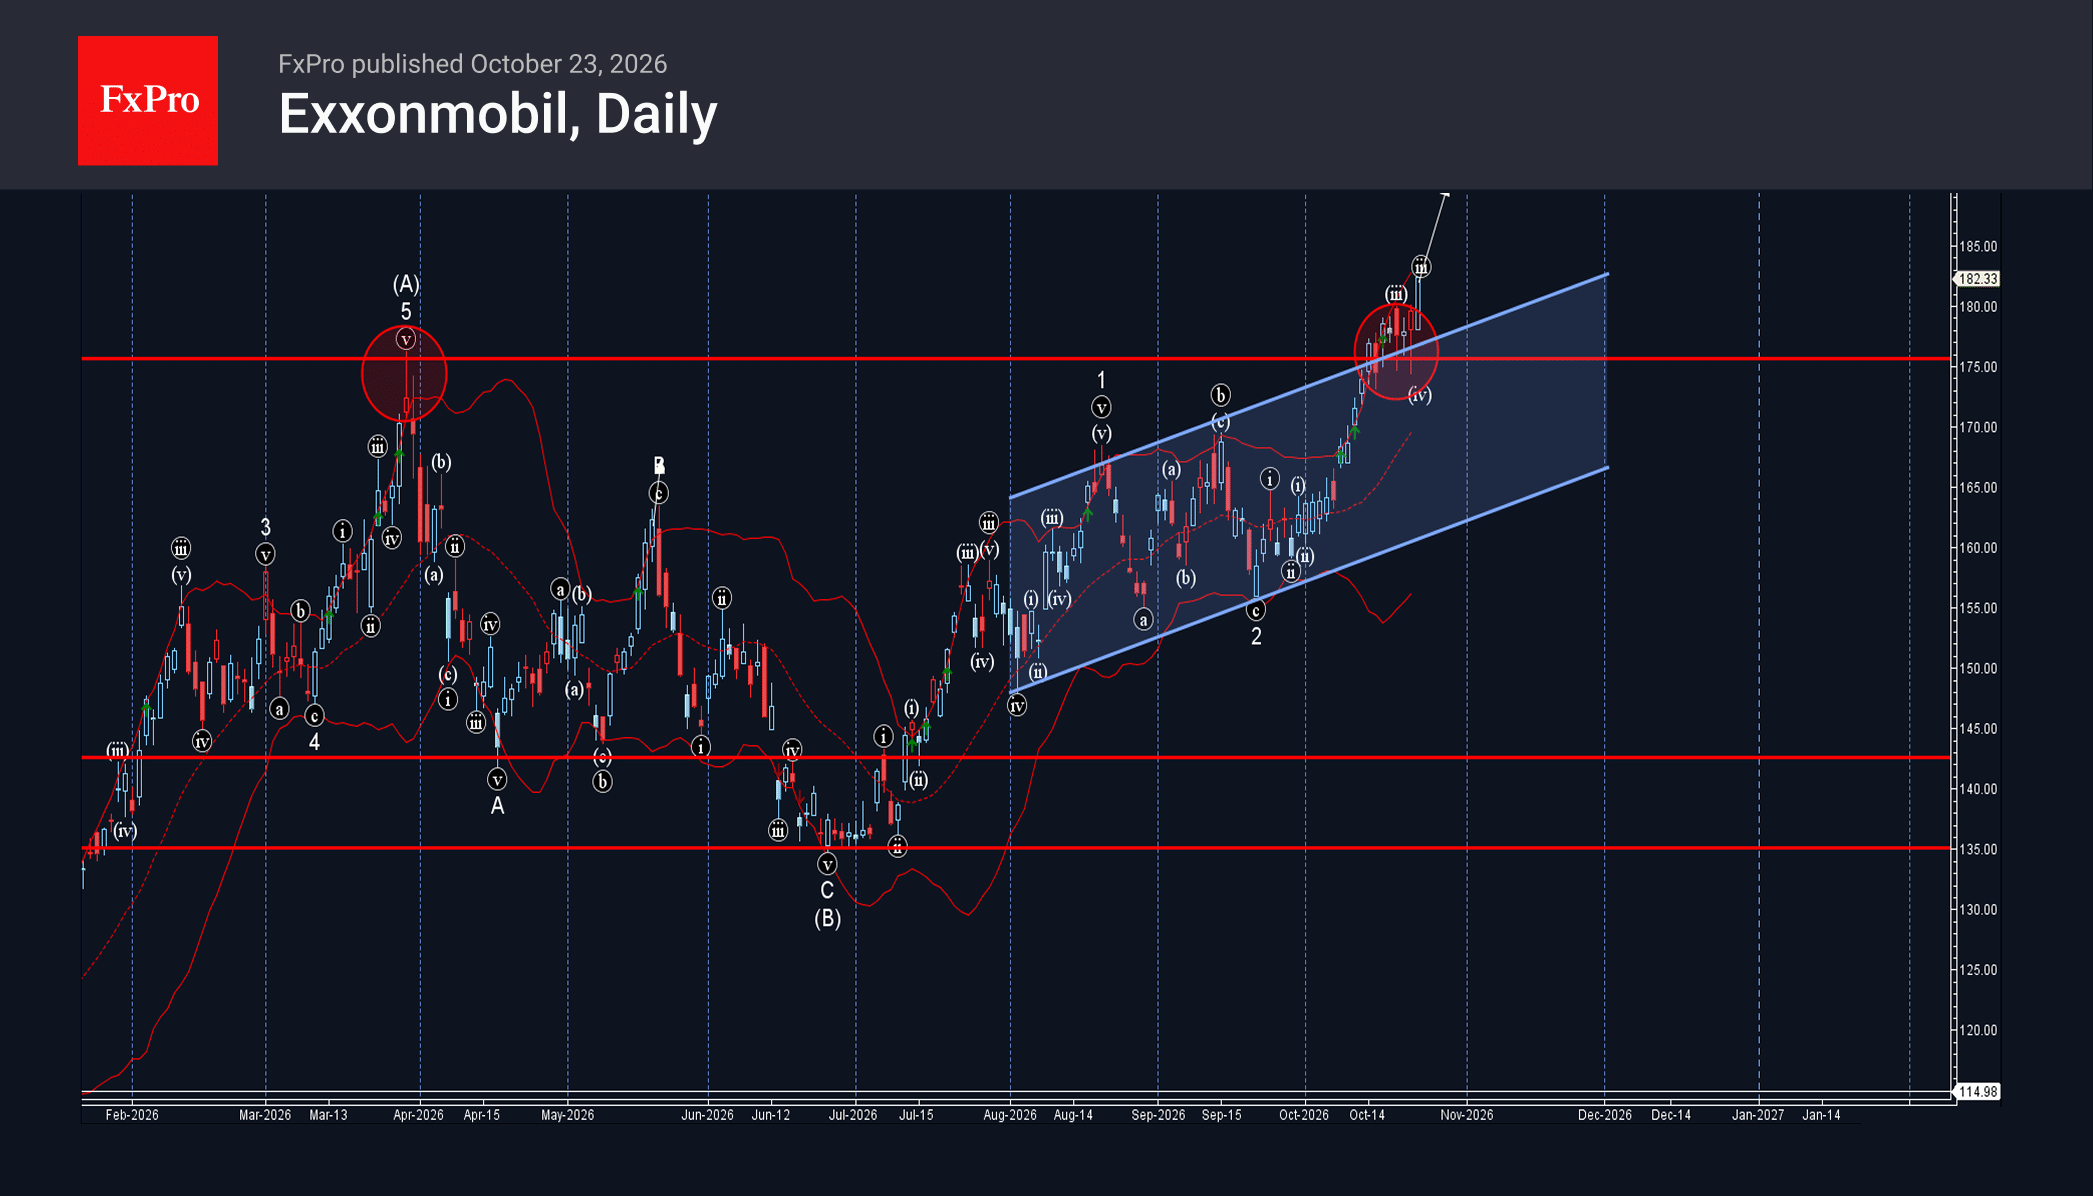
Exxon Mobil: ⬆️ Buy – Exxon Mobil broke resistance zone – Likely to rise to resistance level 190.00 Exxon Mobil recently broke the resistance zone between the resistance level 175.00 (which stopped the sharp upward impulse wave (A) at the.
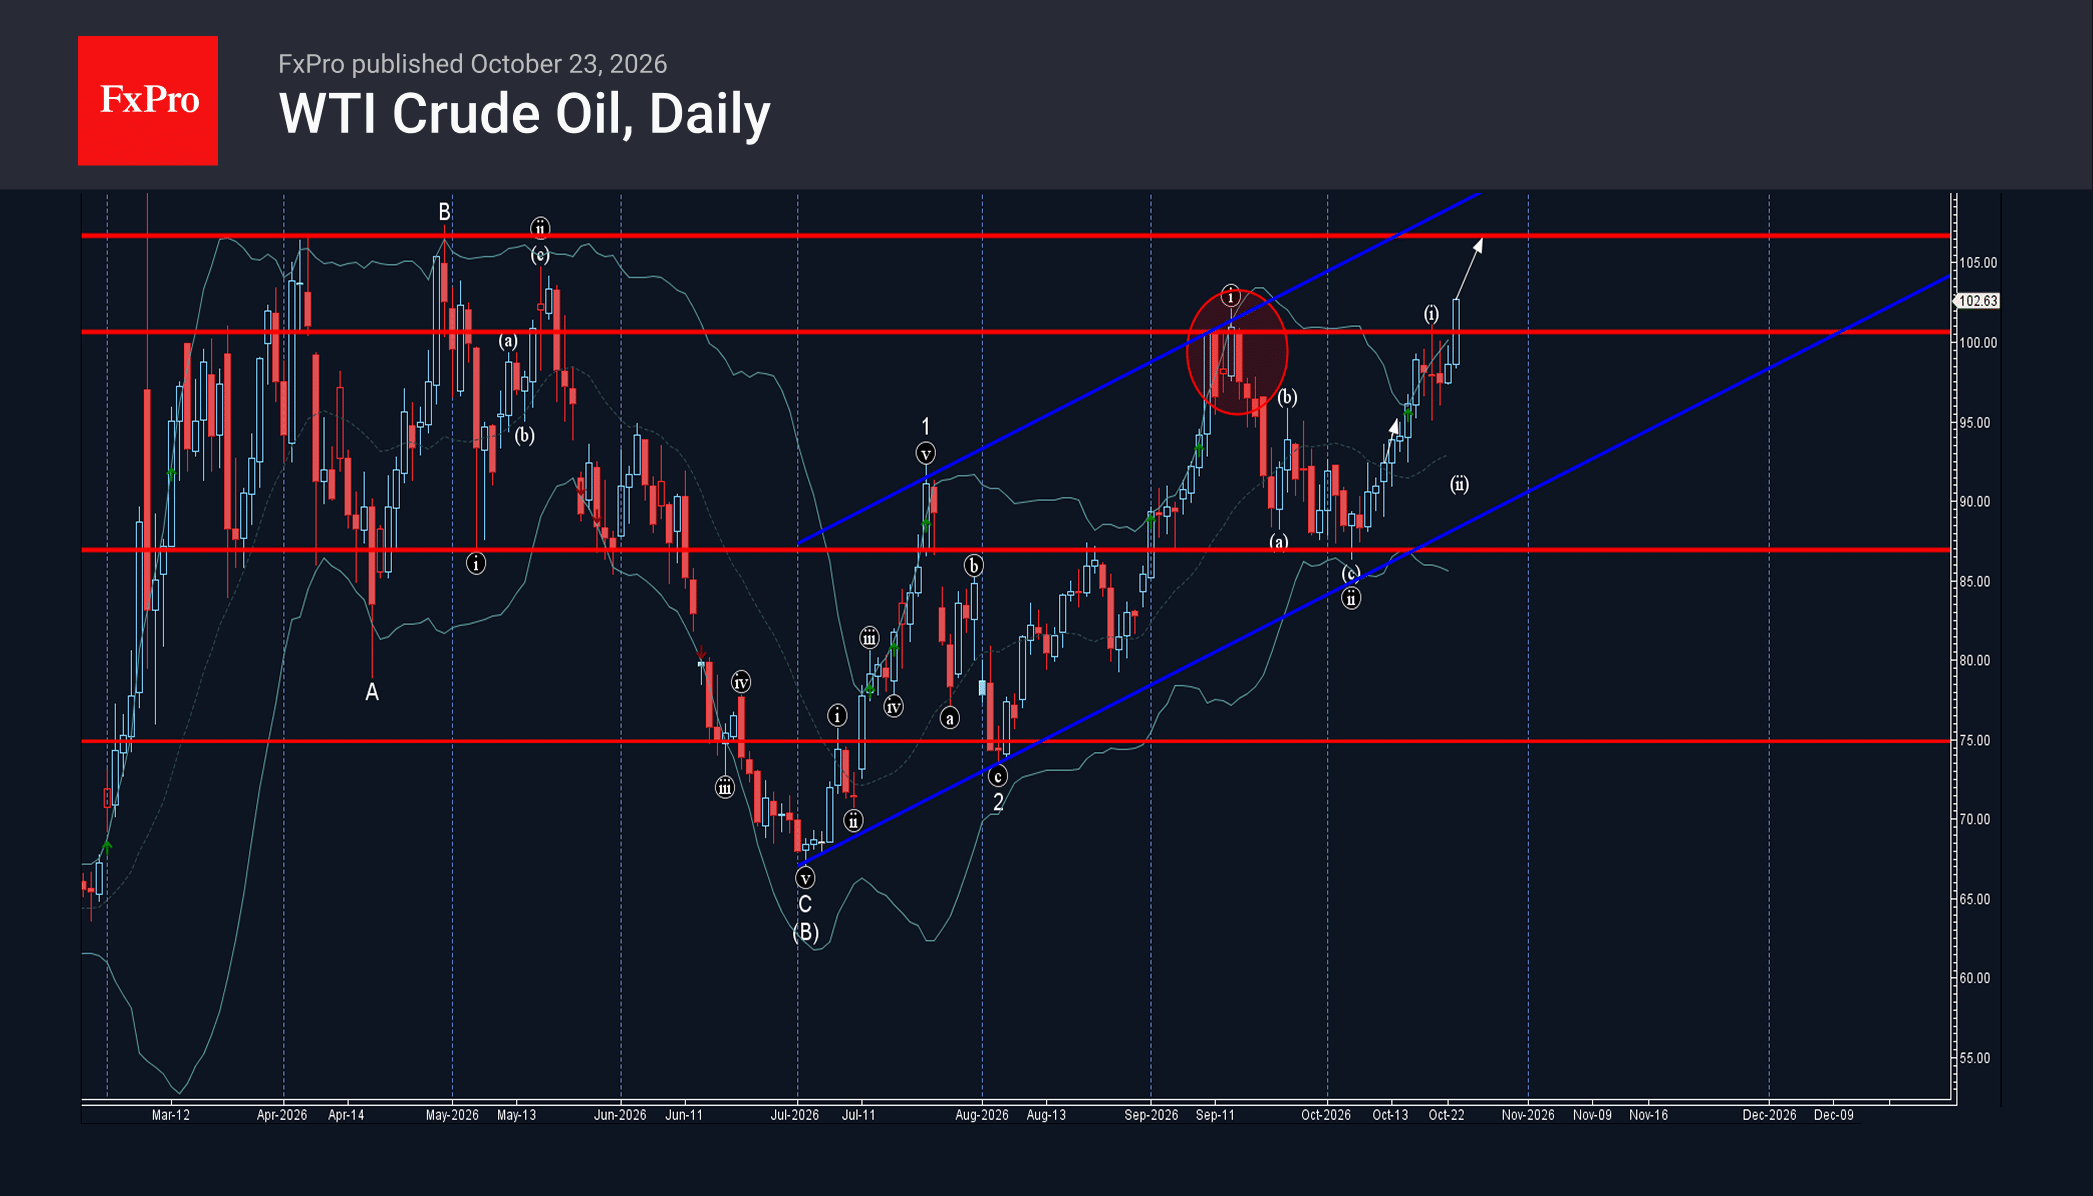
WTI Crude Oil Wave Analysis – 23 October 2026 WTI Crude Oil: ⬆️ Buy – WTI Crude Oil broke resistance level 100.70 – Likely to rise to resistance level 106.70 WTI Crude Oil recently broke the resistance level 100.70, which.
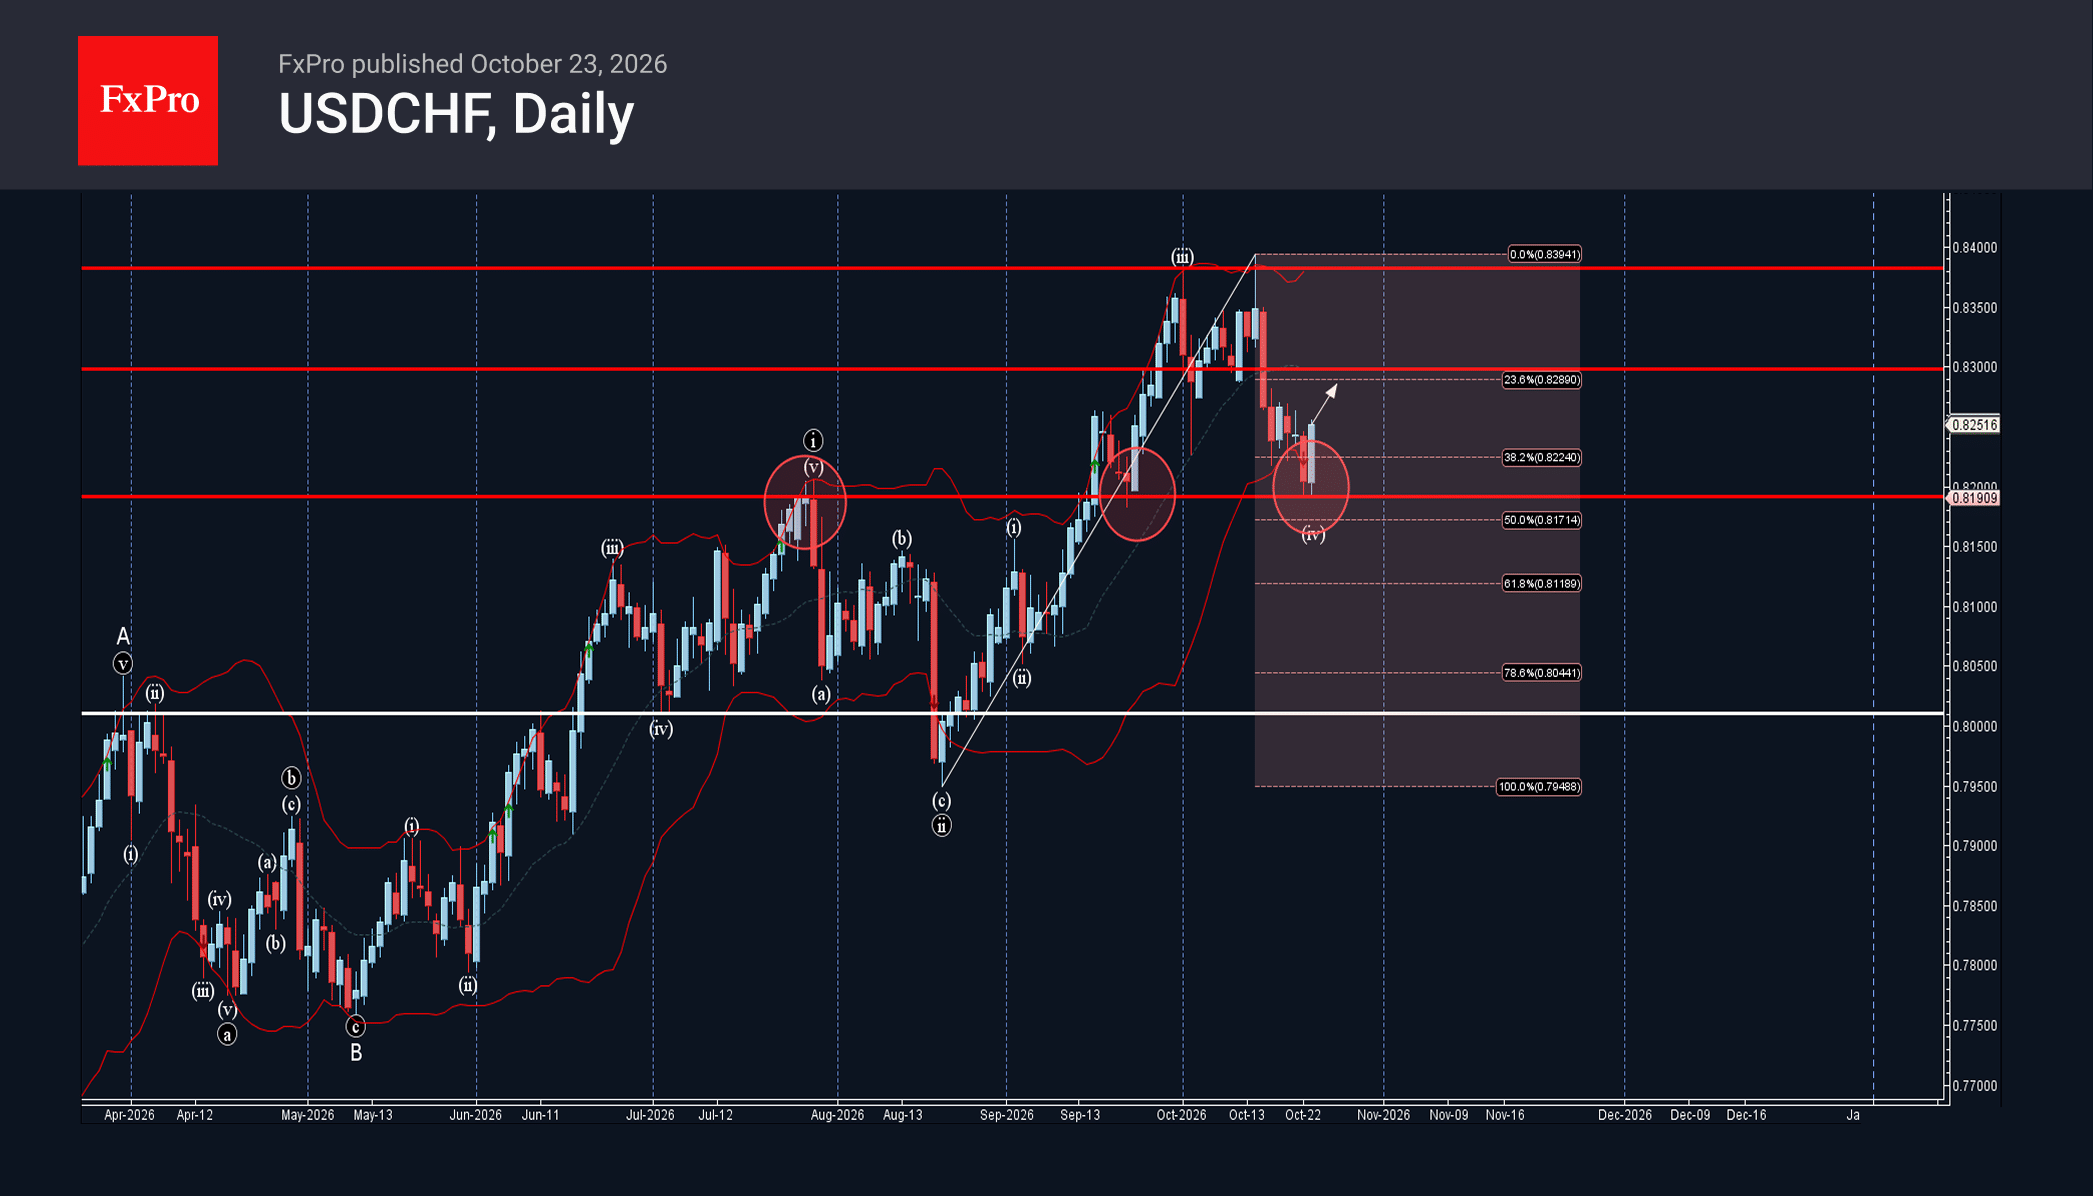
USDCHF: ⬆️ Buy – USDCHF reversed from key support level 0.8200 – Likely to rise to resistance level 0.8300 USDCHF currency pair recently reversed up from the support zone between the key support level 0.8200 (former strong resistance from the.
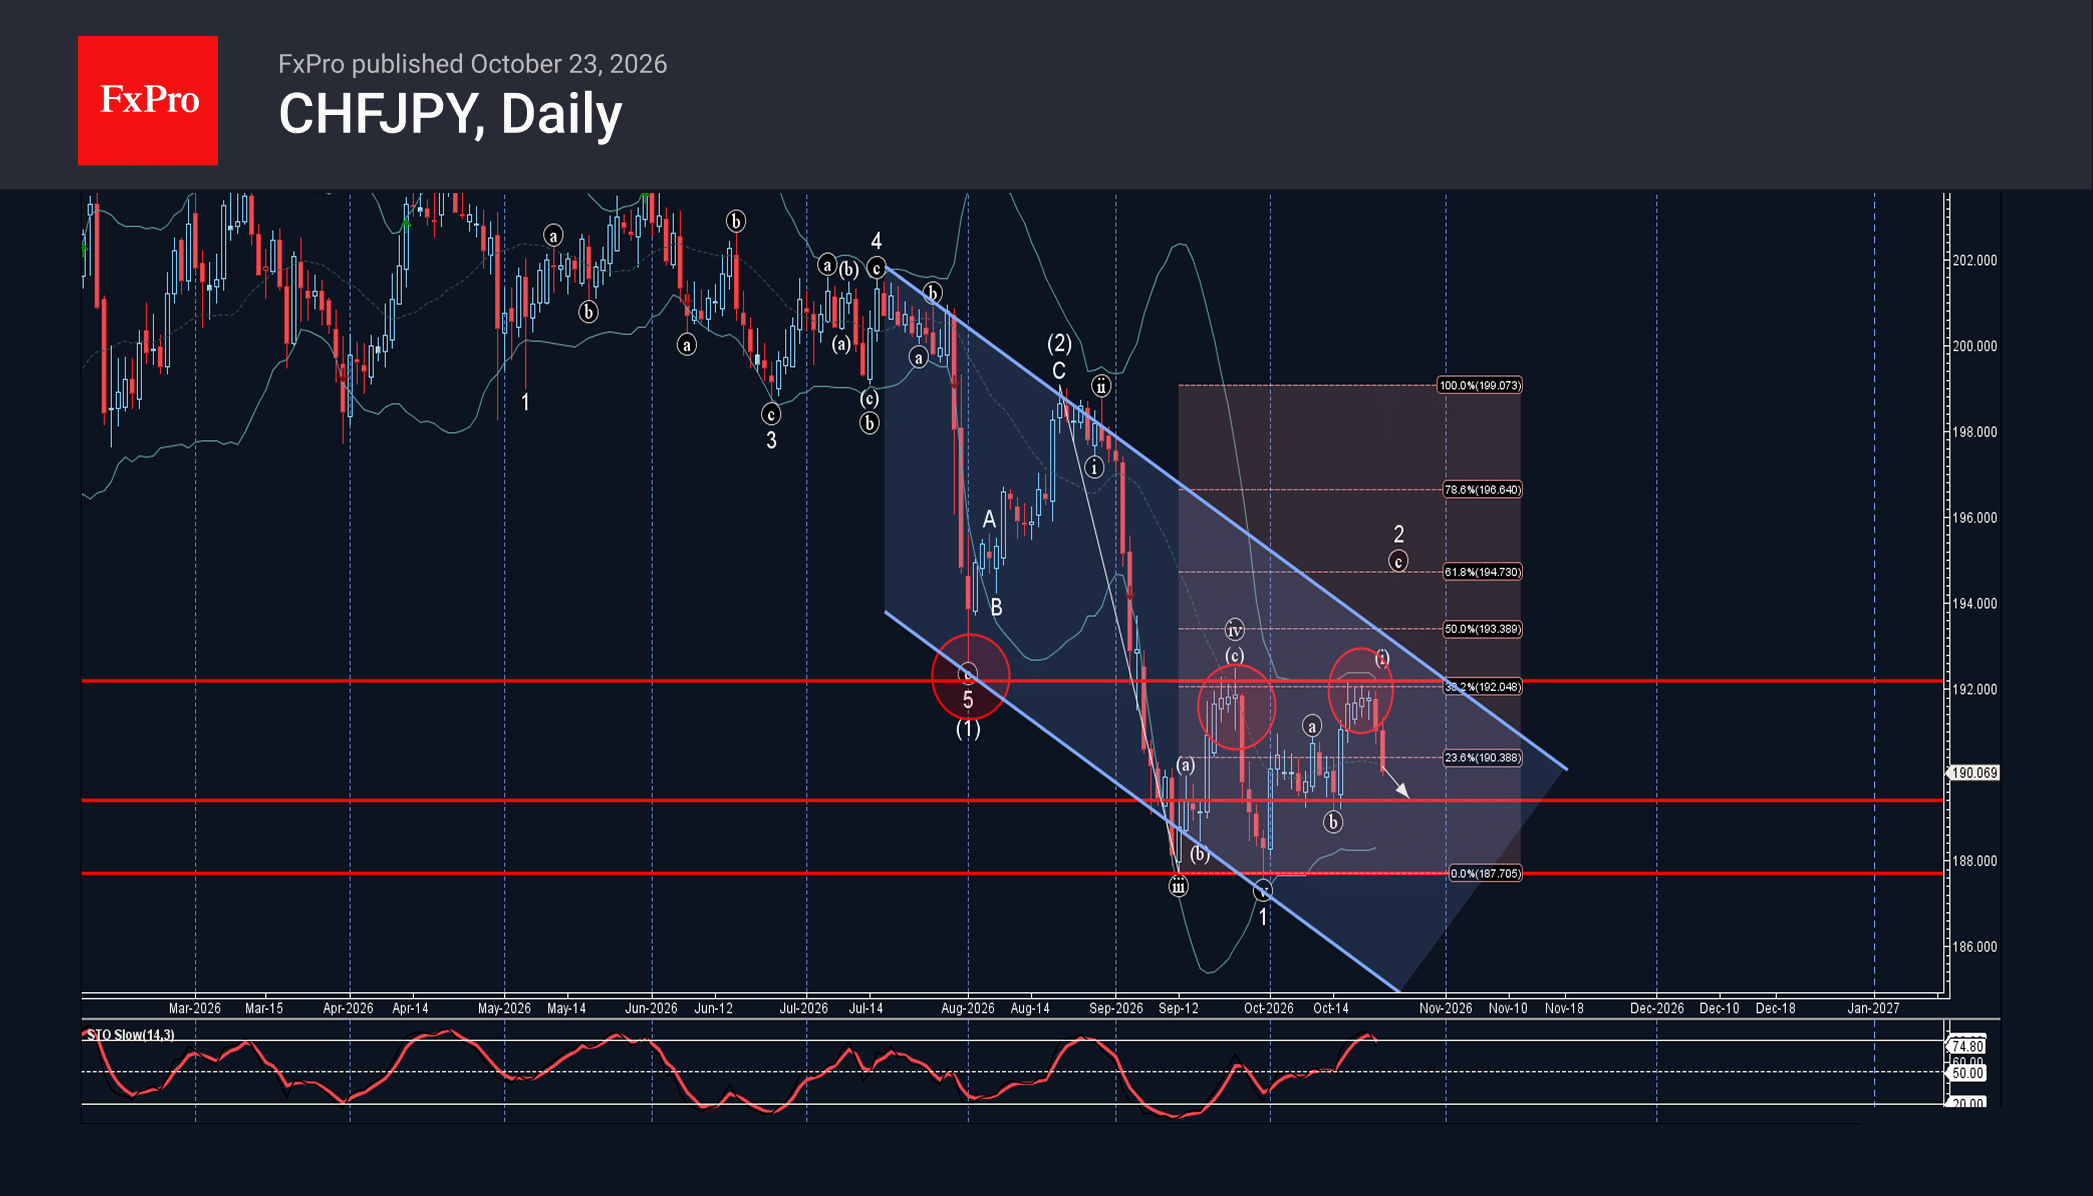
CHFJPY: ⬇️ Sell – CHFJPY reversed from resistance level 192.15 – Likely to fall to support level 189.50 CHFJPY currency pair recently reversed down from the resistance zone between the resistance level 192.15 (former support from the start of August,.
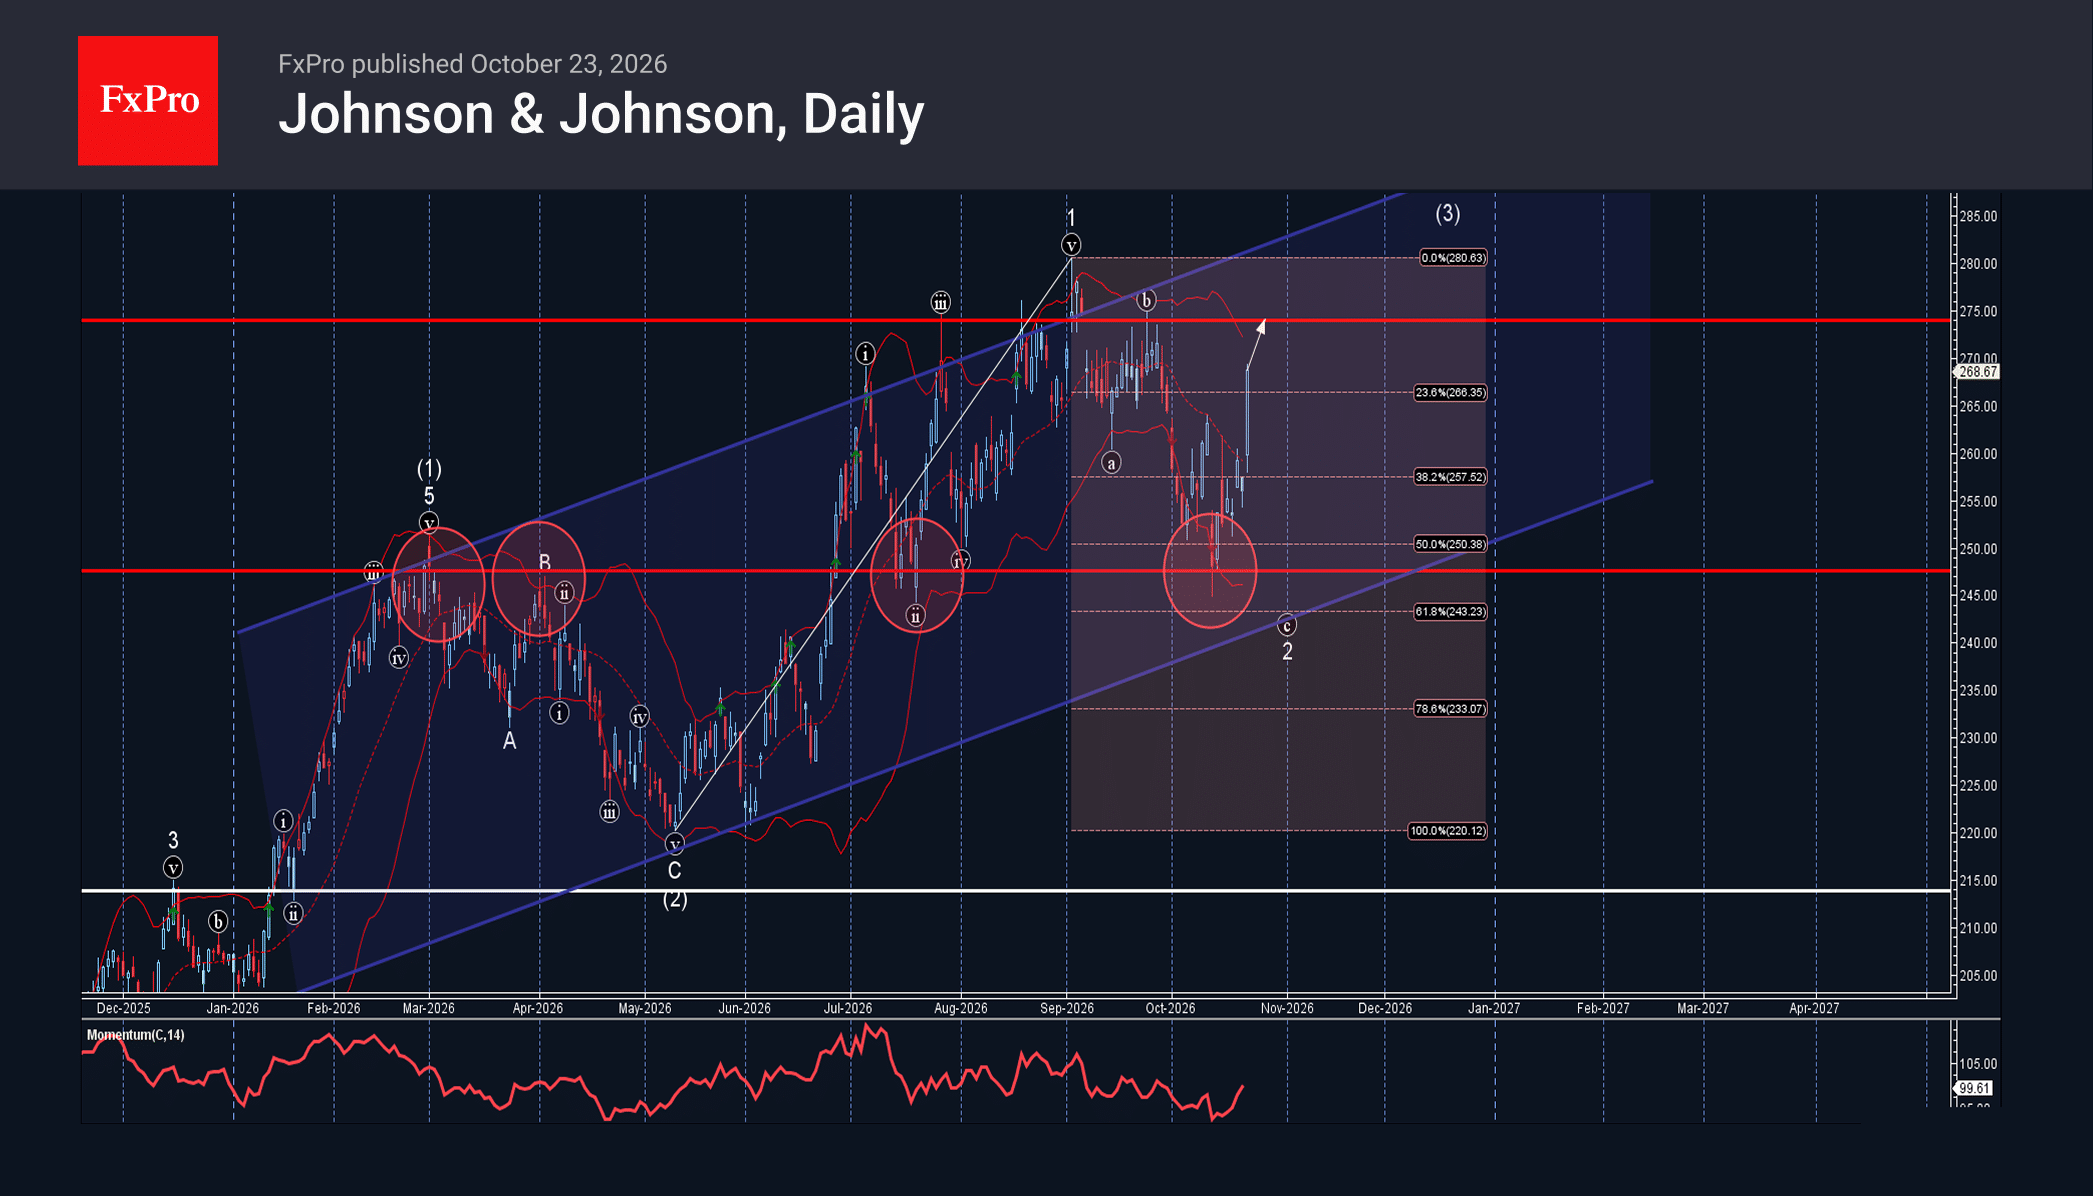
Johnson & Johnson: ⬆️ Buy – Johnson & Johnson reversed from key support level 248.00 – Likely to rise to resistance level 274.00 Johnson & Johnson recently reversed up from the support zone between the pivotal support level 248.00 (which.
Welcome to Pro News Weekly!
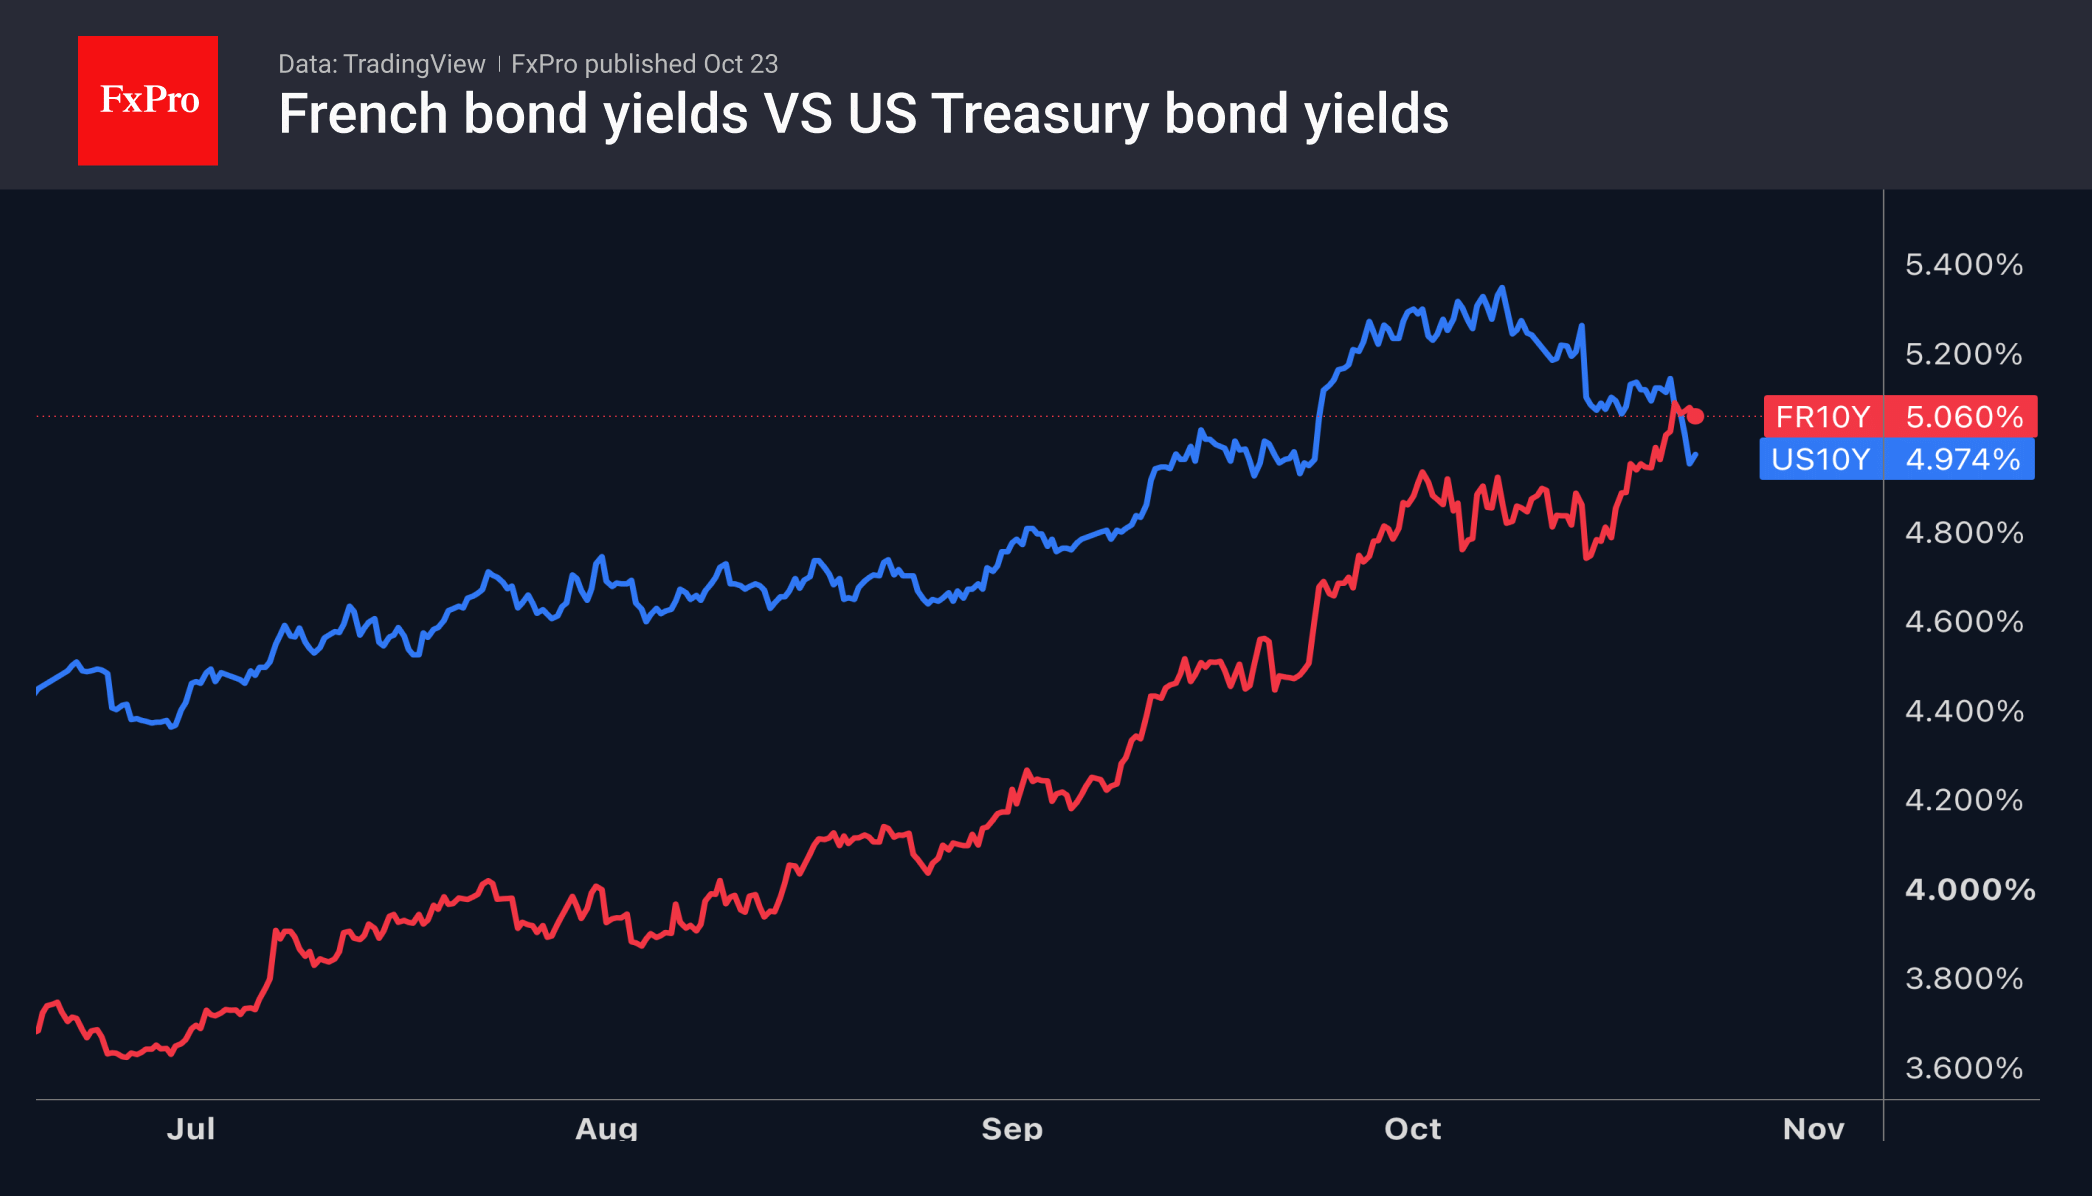
💵 The US dollar struggles to regain momentum as fears over Middle East tensions, the AI bubble and European debt concerns push Treasury yields lower. Meanwhile, hawkish signals from other central banks support their currencies.
October 23, 2026 Market Overview
EURUSD is under pressure from French capital outflows and possible ECB intervention, while the yen and franc gain as safe havens. Consolidation is likely ahead of central bank meetings.
October 23, 2026 Crypto Review
Bitcoin is holding steady at $81K, testing the 50-day MA and support at August’s highs. The sentiment index has returned to 50, while rising open interest increases the risk of liquidations.
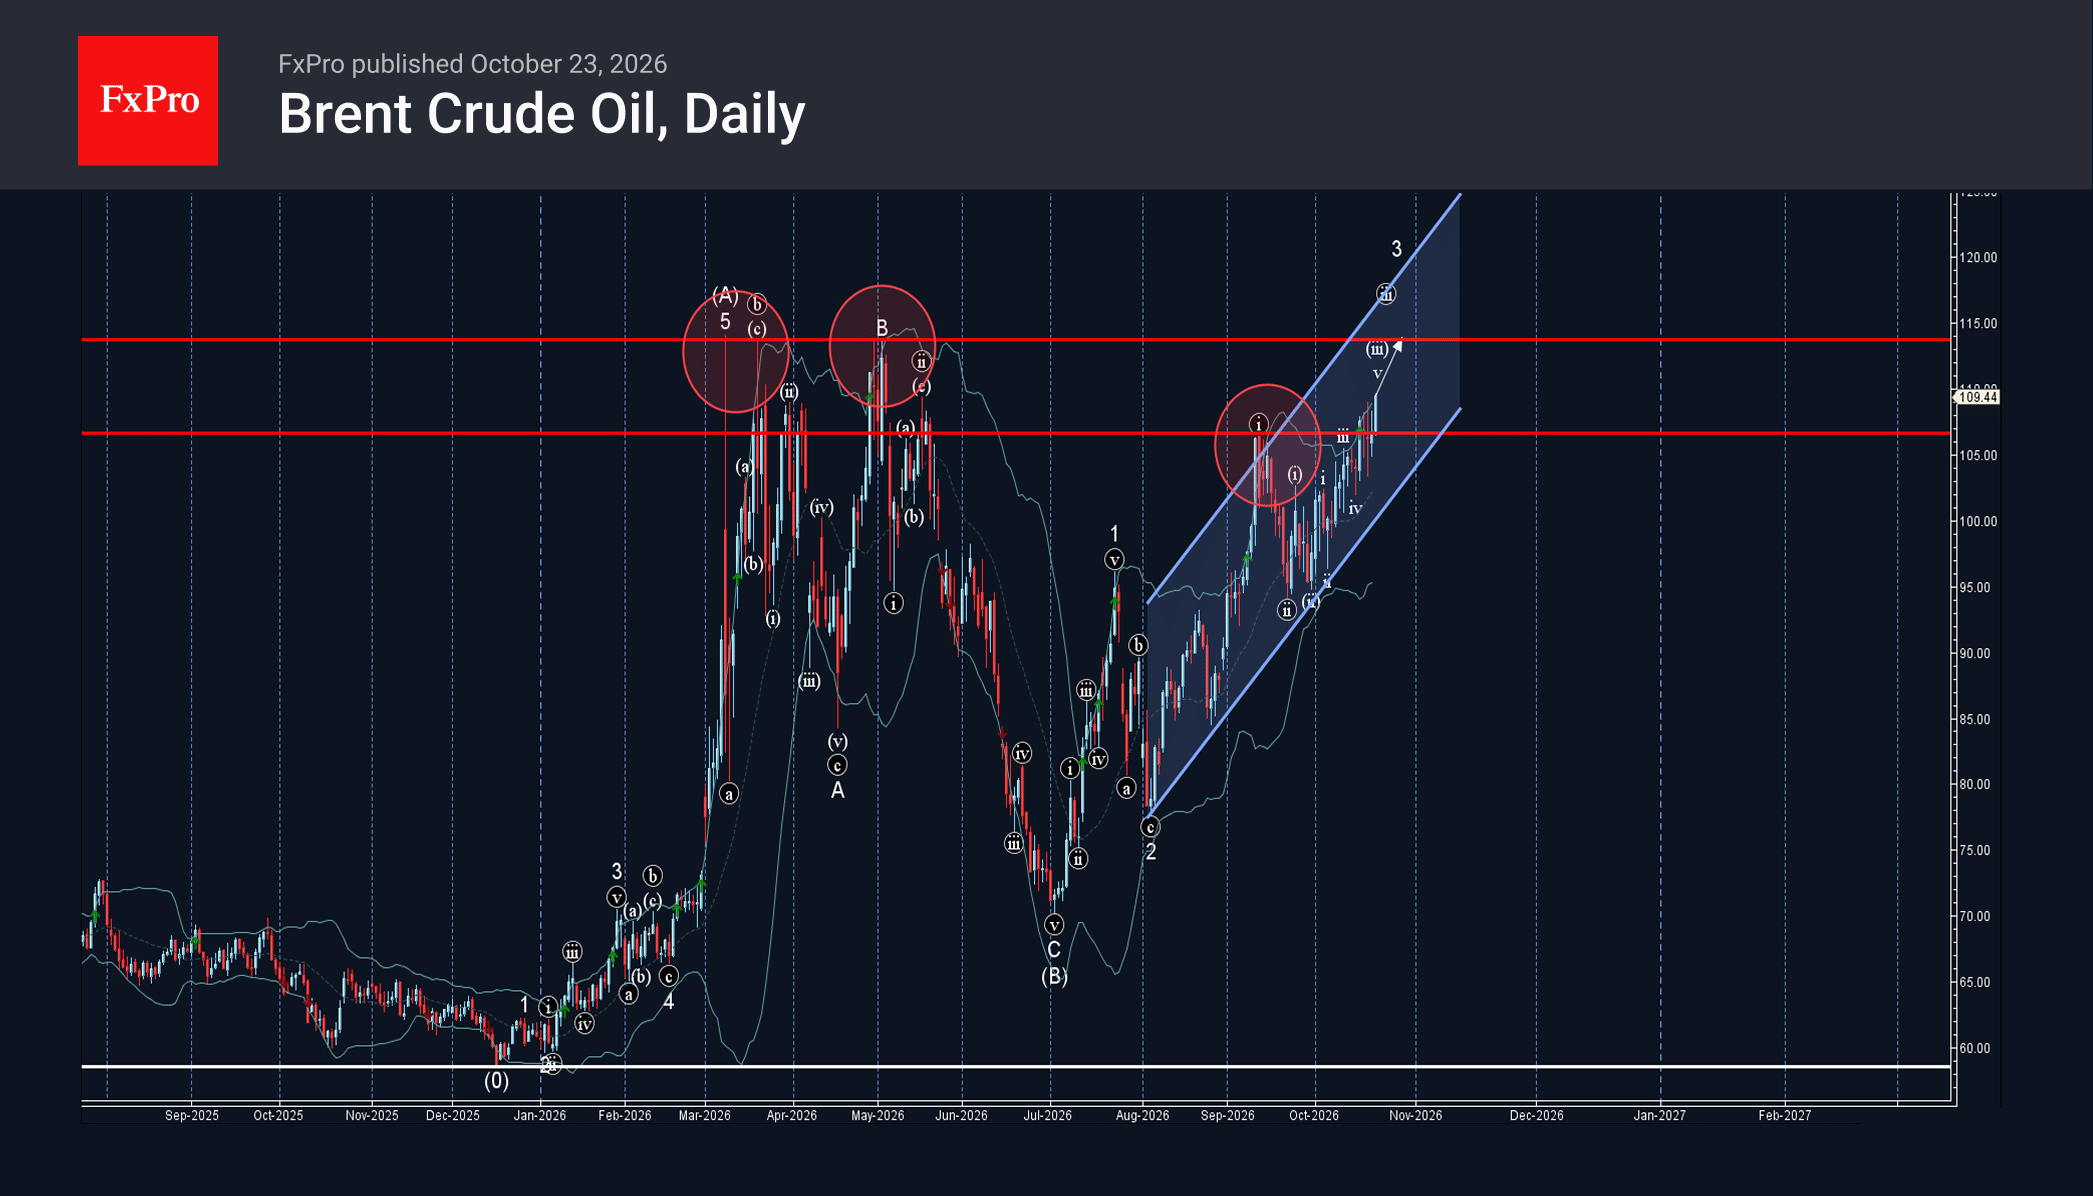
Brent Crude Oil: ⬆️ Buy – Brent Crude Oil broke resistance level 106.60 – Likely to rise to resistance level 113.80 Brent Crude Oil recently broke the resistance level 106.60, which stopped the previous impulse wave i at the start.
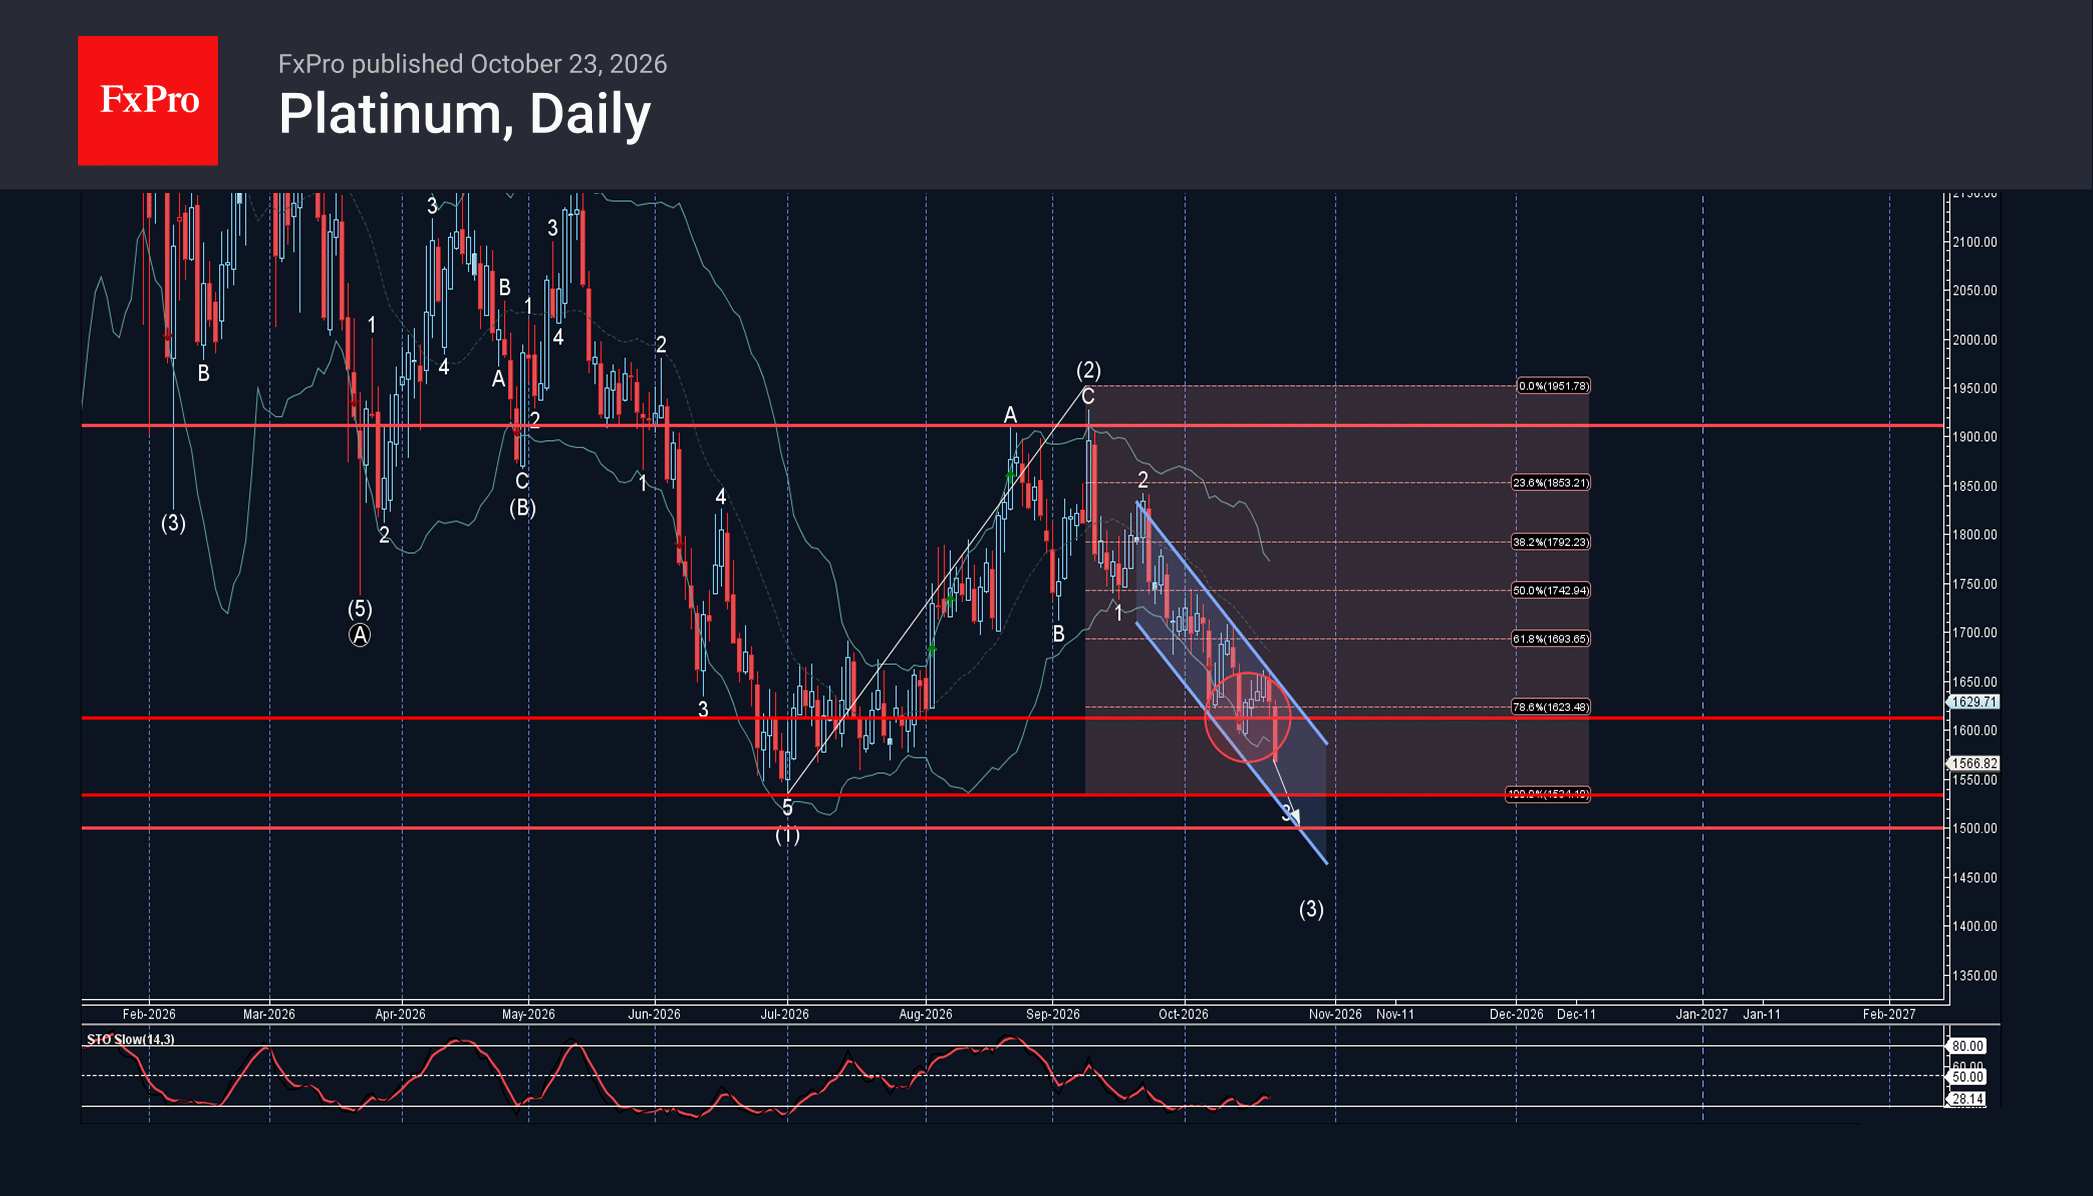
Platinum: ⬇️ Sell – Platinum broke support level 1610.00 – Likely to fall to support level 1500.00 Platinum recently broke the support zone between the support level 1610.00 (which has been reversing the price from the middle of October) and.