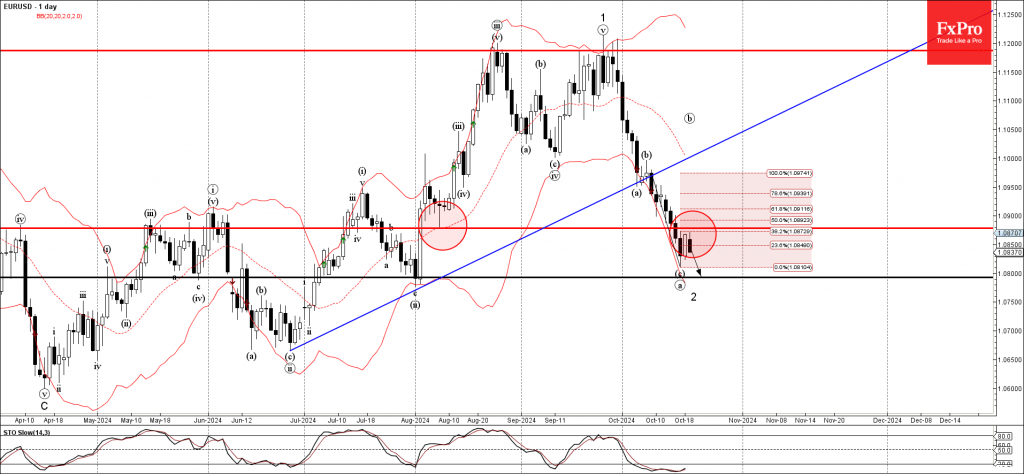
– EURSUD reversed from resistance level 1.0875 – Likely to fall to support level 1.0800 EURSUD currency pair recently reversed down from the key resistance level 1.0875 (former support from the start of August) standing near the 38.2% Fibonacci correction of.
October 21, 2024 @ 18:11 +03:00
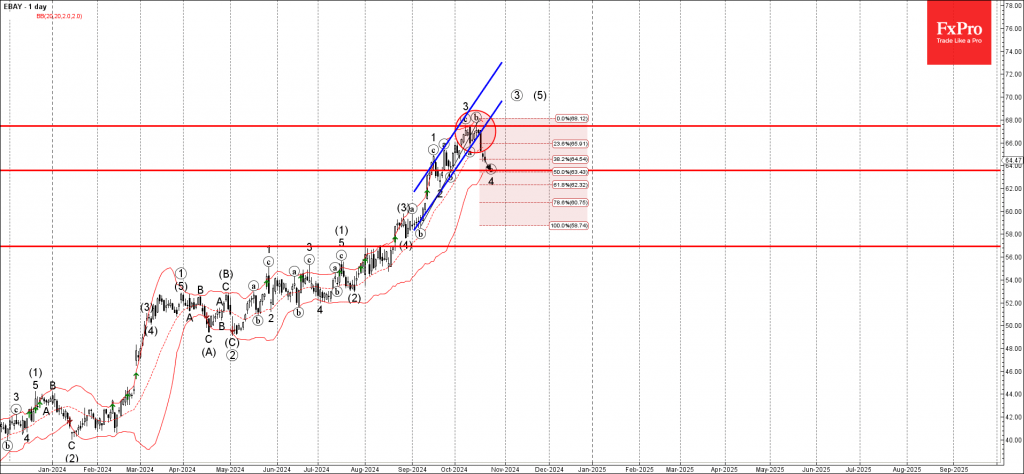
– Ebay reversed from strong resistance level 67.45 – Likely to fall to support level 64.00 Ebay recently reversed down twice from the strong resistance level 67.45 (which stopped the previous impulse wave 3) intersecting with the upper daily Bollinger.
5h ago
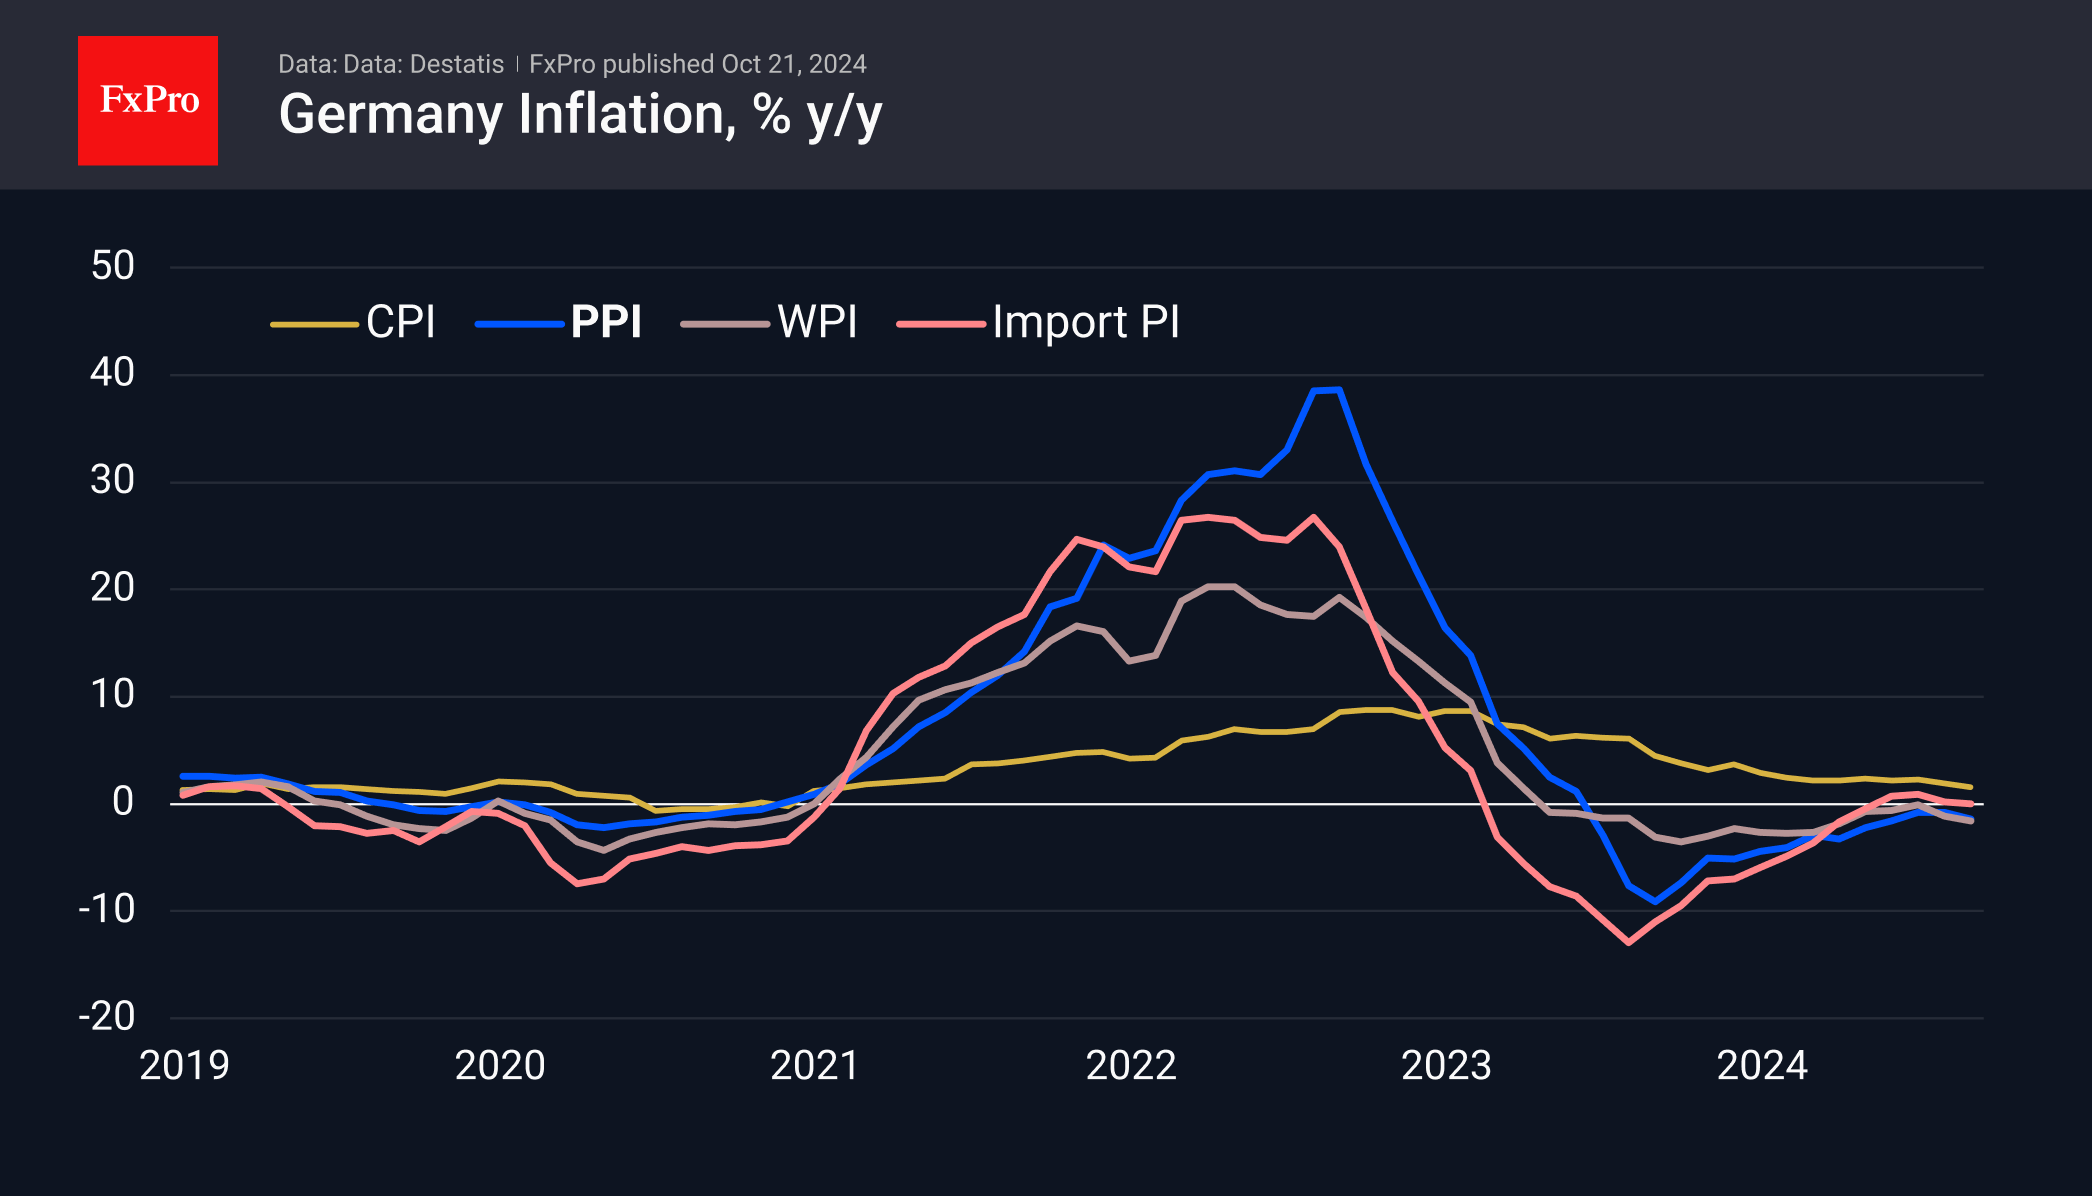
The German Producer Price Index fell more than expected, increasing the likelihood of further monetary policy easing in the eurozone. This weakened the euro against the dollar, with a potential path towards lower support levels.
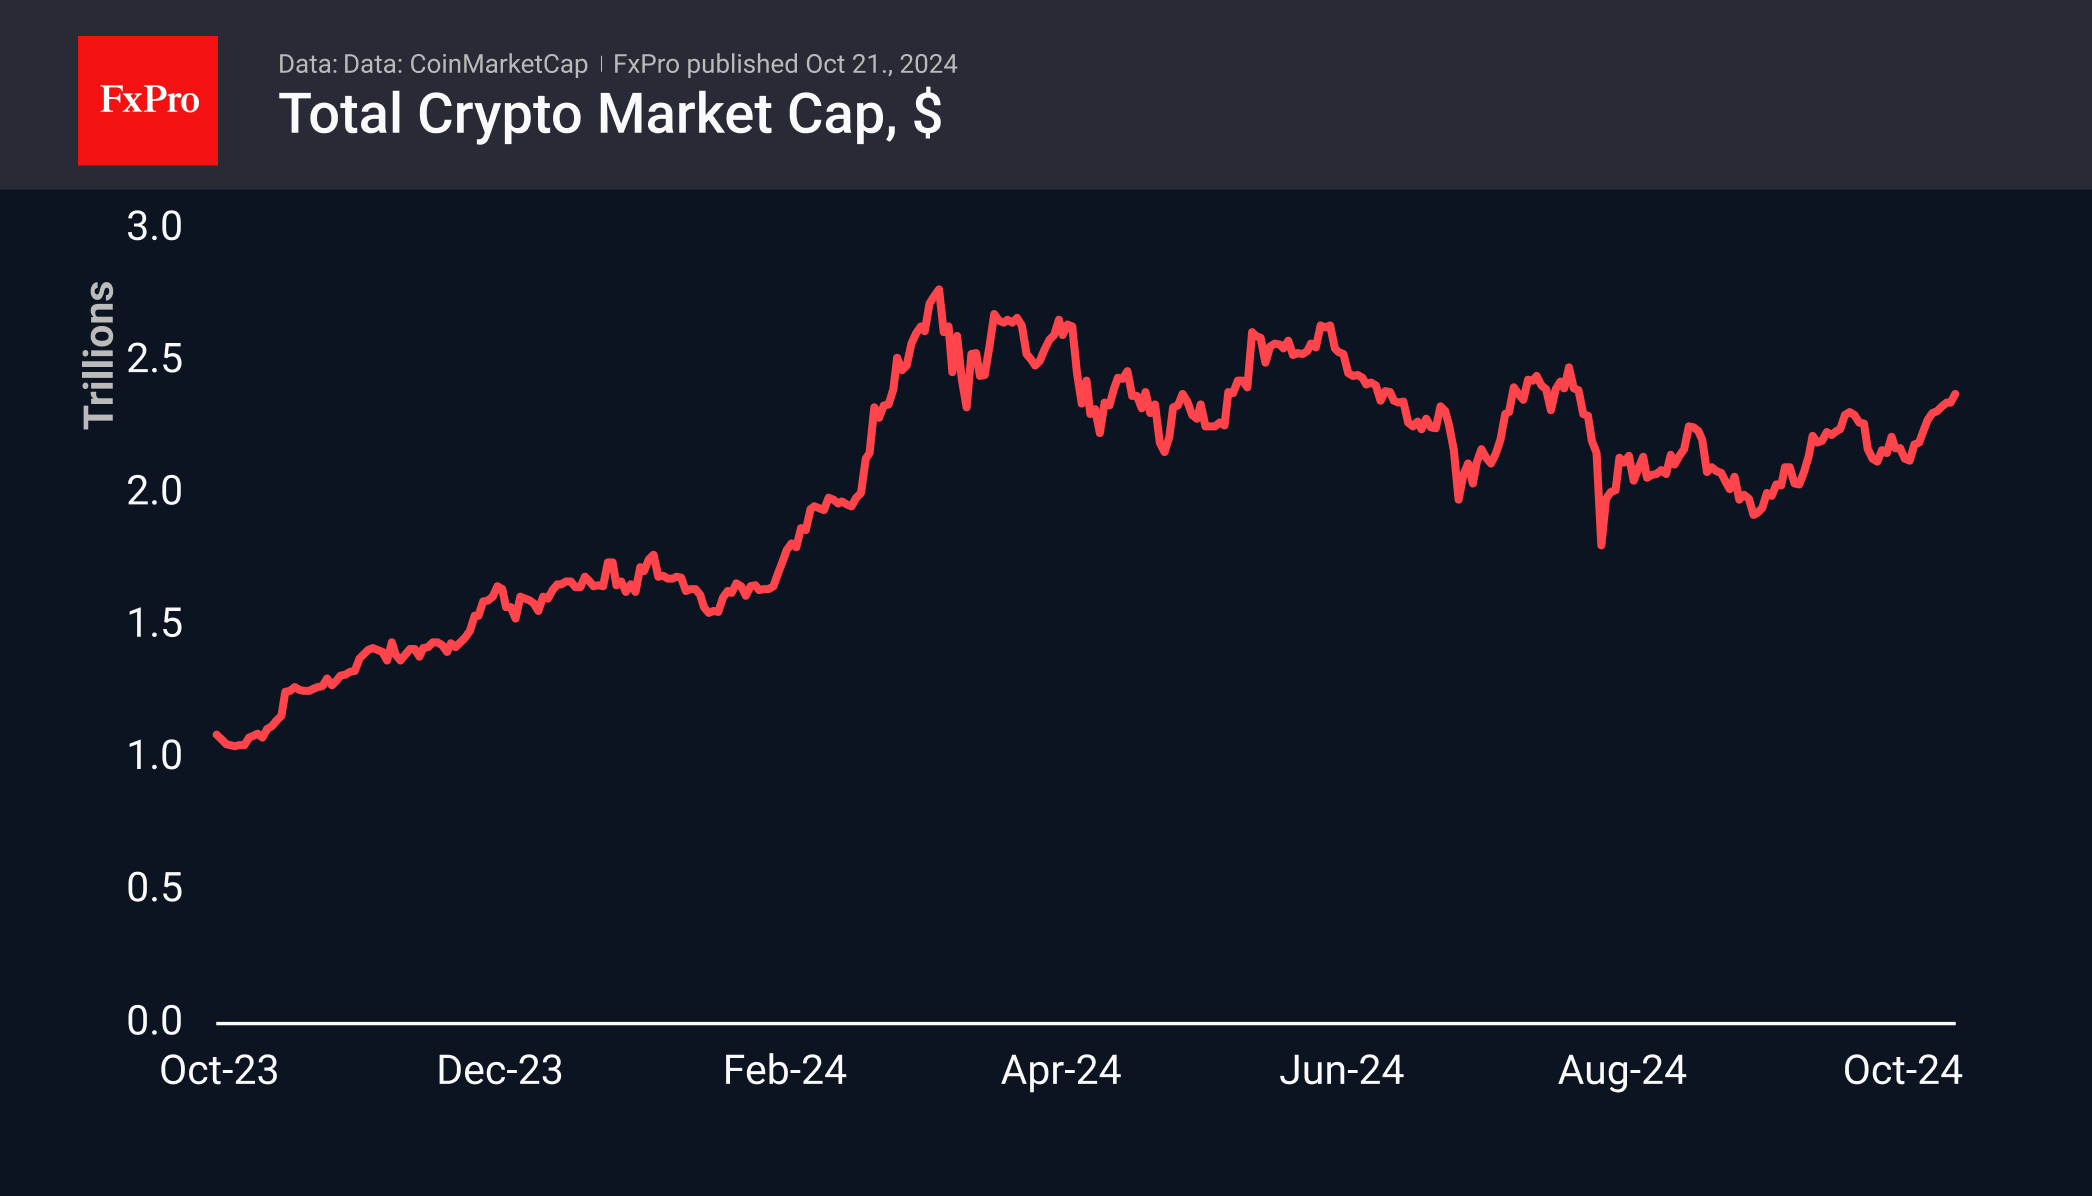
Market Picture The crypto market has maintained its upward trajectory, with total capitalisation up more than 7% in seven days to $2.39 trillion, the highest since late July. The Cryptocurrency Fear and Greed Index is in the 71-73 (greed) range.
October 21, 2024 @ 11:50 +03:00
Market Picture The crypto market has maintained its upward trajectory, with total capitalisation up more than 7% in seven days to $2.39 trillion, the highest since late July. The Cryptocurrency Fear and Greed Index is in the 71-73 (greed) range.
October 18, 2024 @ 16:45 +03:00
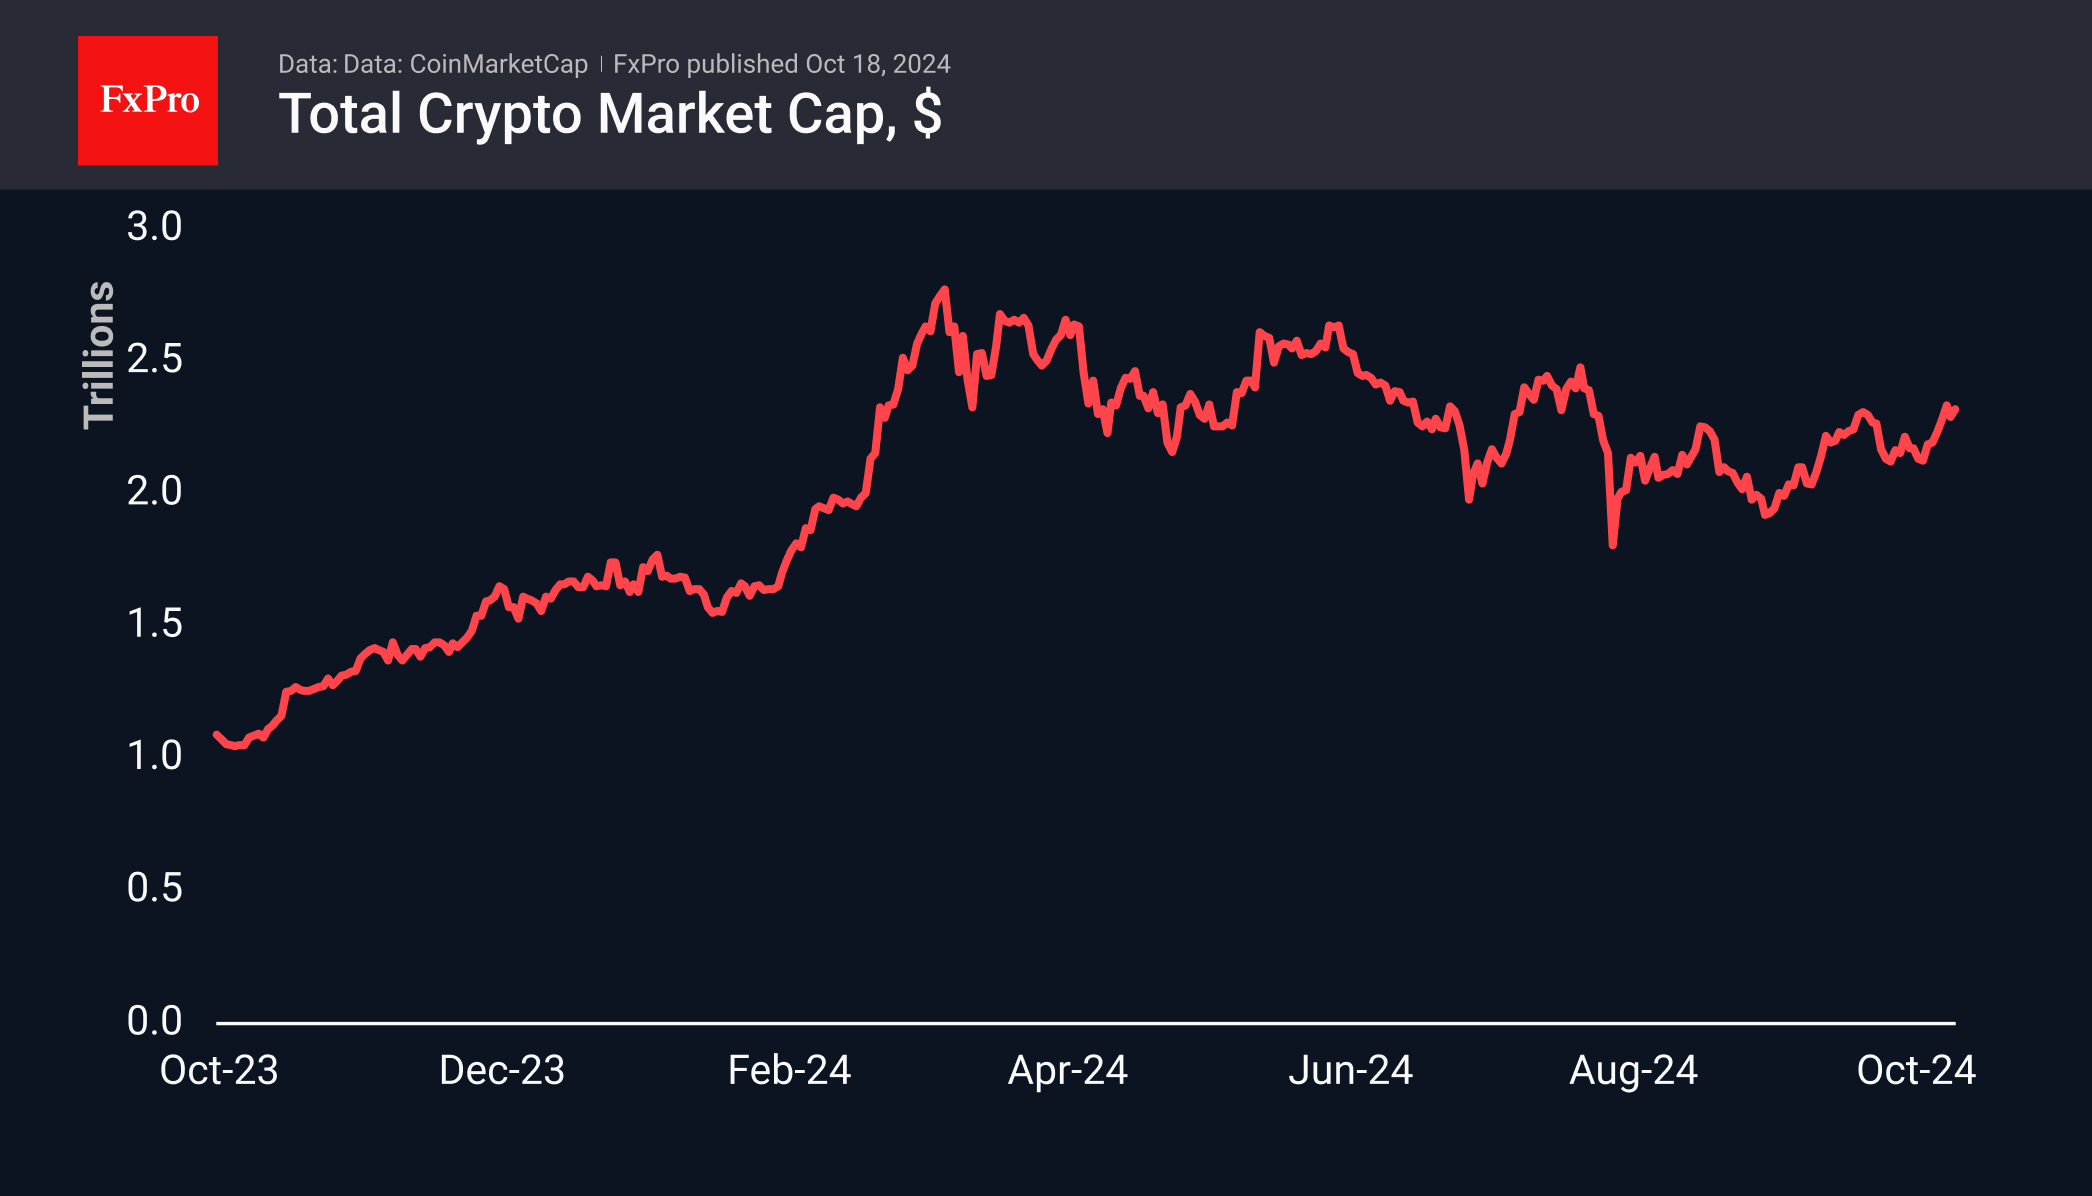
Market picture The crypto market has gained around 8% over the past seven days, stabilising near $2.30 trillion over this week and reaching a capitalisation of $2.32 trillion at the time of writing on Friday. The sentiment index is firmly.
Mon
Thu
Tue
Mon
Fri
Thu
Wed
October 21, 2024 @ 18:11 +03:00
– Ebay reversed from strong resistance level 67.45 – Likely to fall to support level 64.00 Ebay recently reversed down twice from the strong resistance level 67.45 (which stopped the previous impulse wave 3) intersecting with the upper daily Bollinger.
October 21, 2024 @ 18:11 +03:00
– EURSUD reversed from resistance level 1.0875 – Likely to fall to support level 1.0800 EURSUD currency pair recently reversed down from the key resistance level 1.0875 (former support from the start of August) standing near the 38.2% Fibonacci correction of.
October 17, 2024 @ 20:14 +03:00
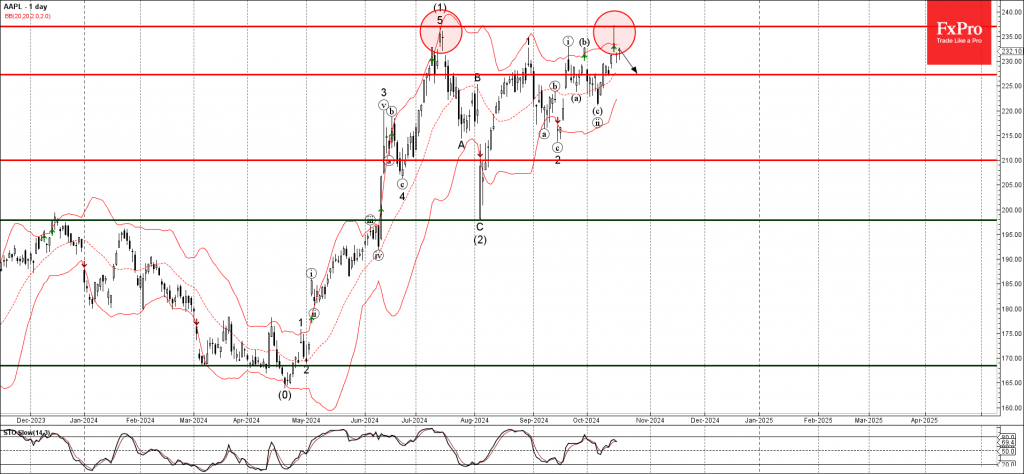
– Apple reversed from key resistance level 237.00 – Likely to fall to support level 227.00 Apple recently reversed down from the key resistance level 237.00 (which stopped the previous sharp impulse wave (1) in the middle of July) standing well above.
October 17, 2024 @ 20:13 +03:00
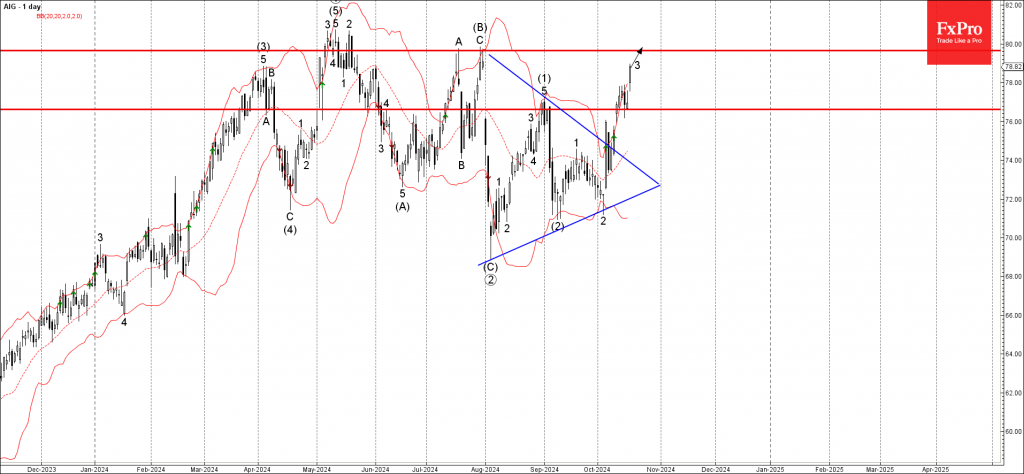
– Aig reversed from support level 76.60 – Likely to rise to resistance level 79.65 Aig recently reversed up from the pivotal support level 76.60 (former strong resistance level which stopped the previous impulse wave (1)) at the end of August. The.
October 17, 2024 @ 00:17 +03:00
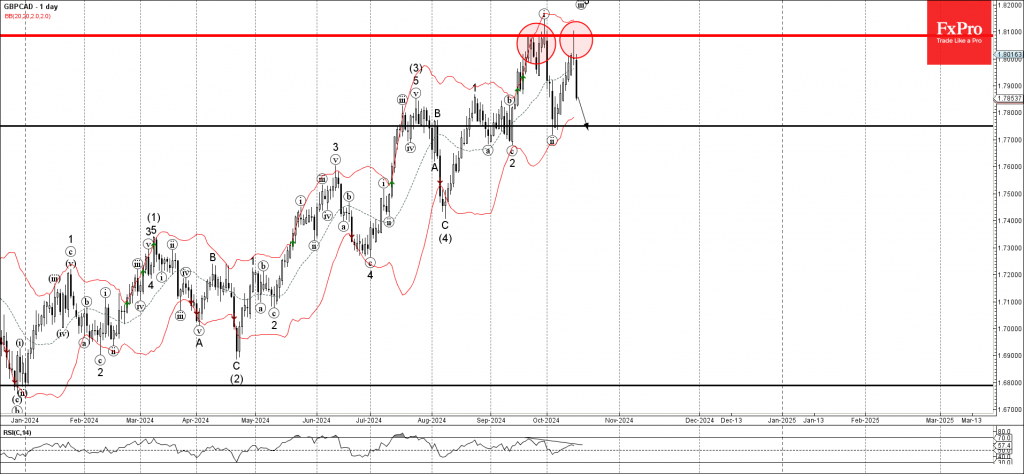
– GBPCAD reversed from resistance zone – Likely to fall to support level 1.7750 GBPCAD currency pair recently reversed down from the key resistance zone between the strong resistance level 1.8085 (which stopped the previous impulse wave i) and the upper.
October 17, 2024 @ 00:17 +03:00
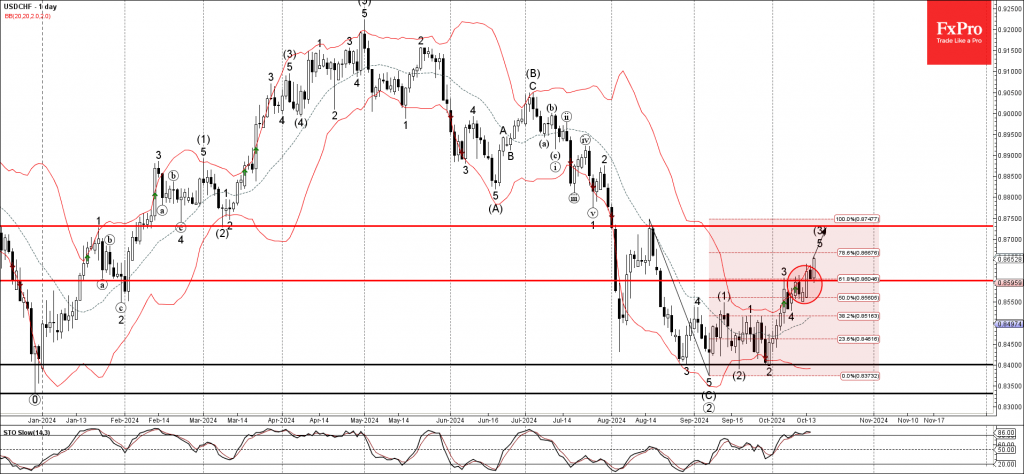
– USDCHF broke resistance zone – Likely to rise to resistance level 0.8730 USDCHF currency pair recently broke the resistance zone between the resistance level 0.8600 (which stopped the previous impulse wave 3) and the 61.8% Fibonacci correction of the downward.
October 15, 2024 @ 23:58 +03:00
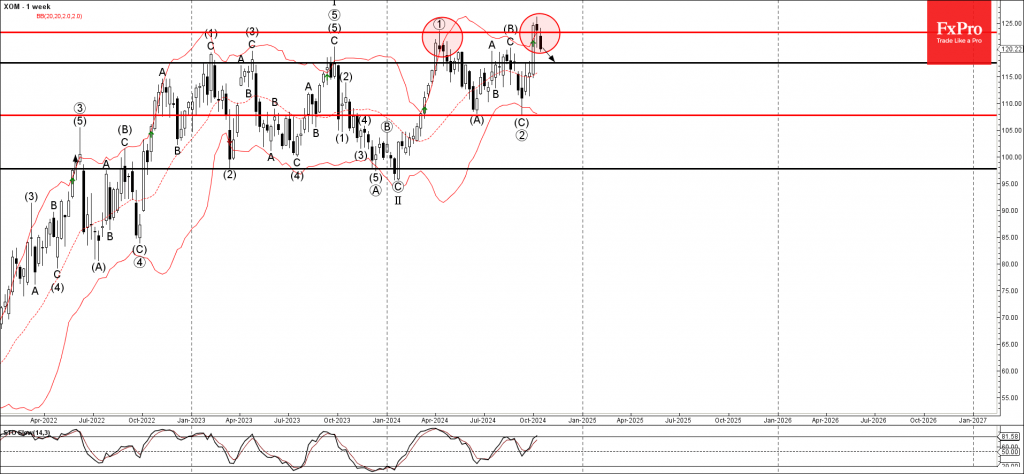
– Exxon Mobil reversed from the resistance zone – Likely to fall to support level 117.55 Exxon Mobil recently reversed from the resistance zone between the pivotal resistance level 123.25 (former monthly high from April) and the upper weekly Bollinger Band. The.
October 15, 2024 @ 23:57 +03:00
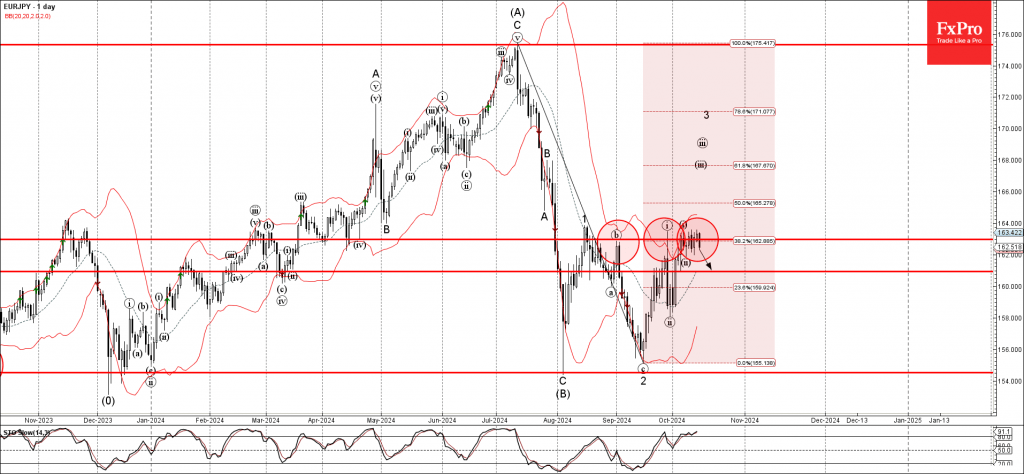
– EURJPY reversed from the resistance zone – Likely to fall to support level 160.90 EURJPY currency pair recently reversed down from the resistance zone located between the key resistance level 163.00 (which has been reversing the price from the.
October 14, 2024 @ 23:39 +03:00
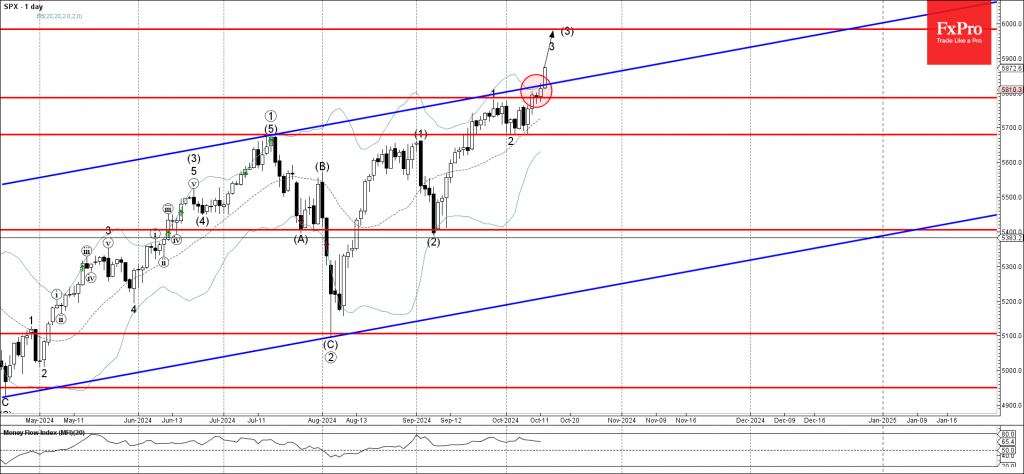
– S&P 500 index broke resistance level 5785.00 – Likely to rise to resistance level 5985.00 S&P 500 index under the bullish pressure after the price broke resistance zone located between the pivotal resistance level 5785.00 (which stopped wave 1.
October 14, 2024 @ 23:38 +03:00
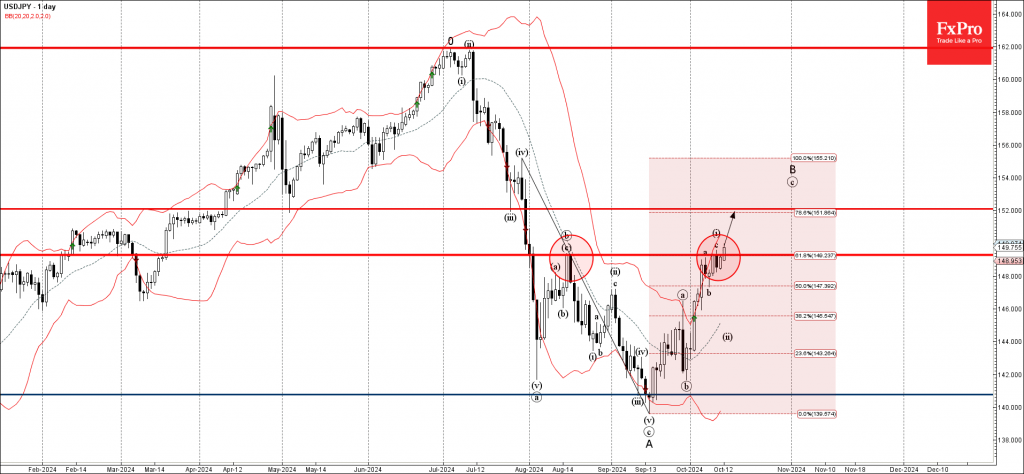
– USDJPY broke resistance zone – Likely to rise to resistance level 152.00 USDJPY currency pair recently broke through resistance zone located between the key resistance level 149.30 (former top of wave b from the middle of August) and the.
October 11, 2024 @ 19:12 +03:00
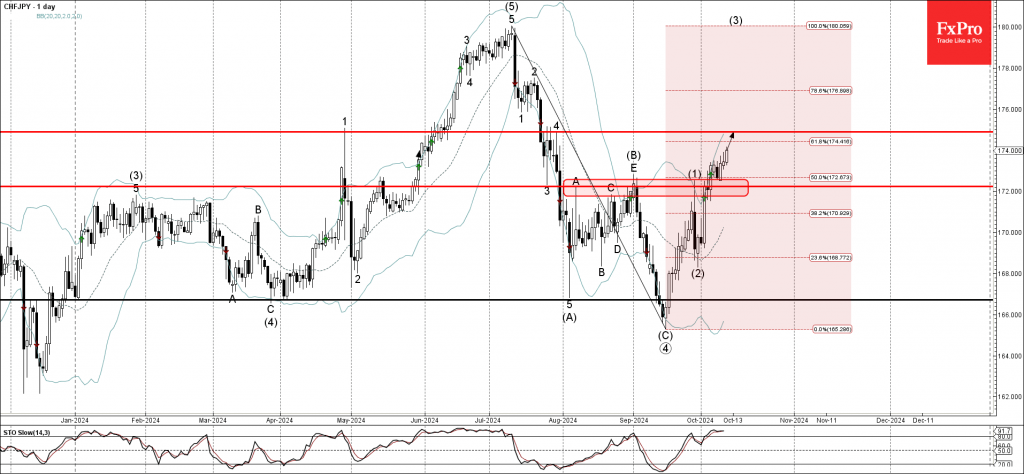
– CHFJPY broke resistance zone – Likely to rise to resistance level 174.90 CHFJPY currency pair under the bullish pressure after the earlier breakout of the resistance zone located between the key resistance level 172.00 (which stopped the previous waves.
October 11, 2024 @ 19:11 +03:00
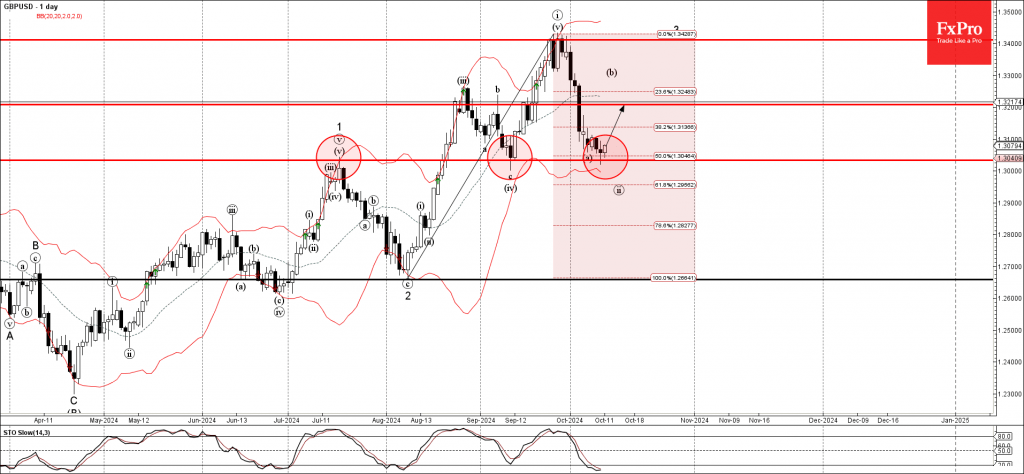
– GBPUSD reversed from support zone – Likely to rise to resistance level 1.3200 GBPUSD currency pair recently reversed up from the support zone located between the pivotal support level 1.3030 (former monthly high from July), lower daily Bollinger Band.
October 10, 2024 @ 13:03 +03:00
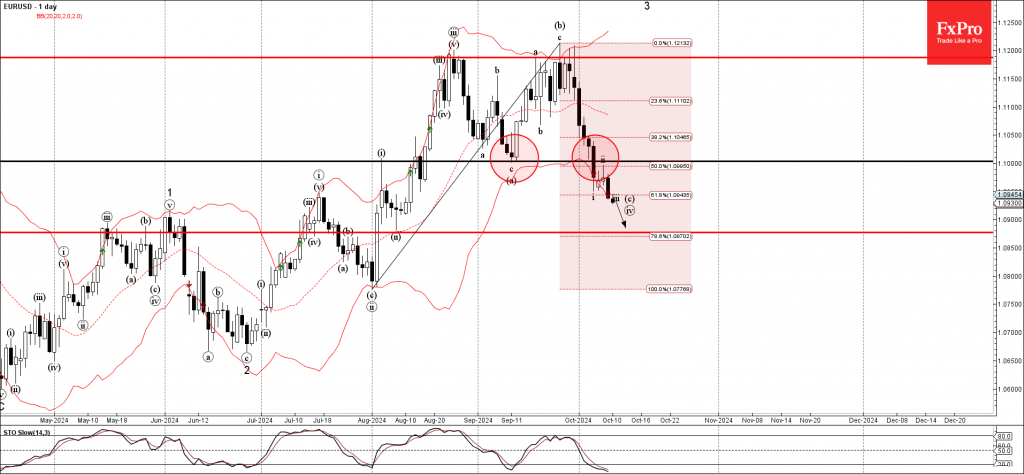
– EURUSD broke support zone – Likely to fall to support level 1.0875 EURUSD currency pair under the bearish pressure after the earlier breakout of the support zone located between the key support level 1.1000 (former monthly low from September).
October 10, 2024 @ 13:02 +03:00
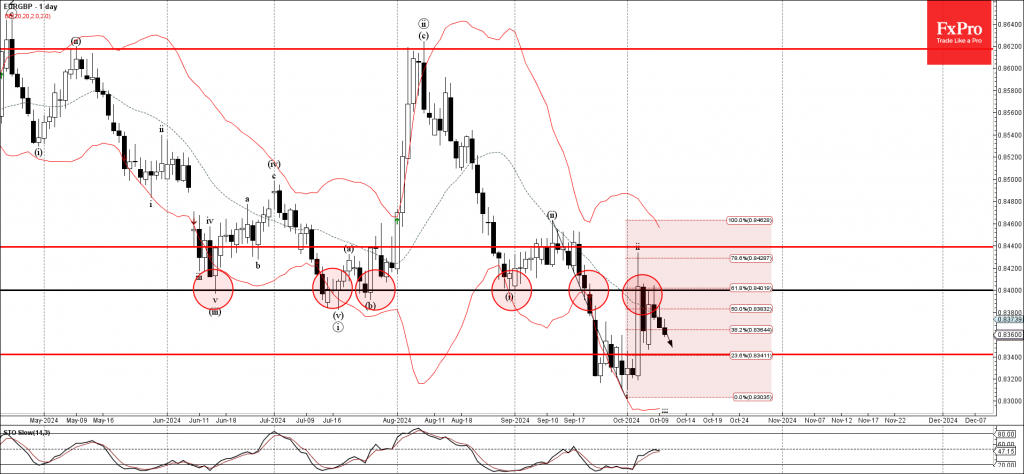
– EURGBP reversed from resistance zone – Likely to fall to support level 0.8340 EURGBP currency pair recently reversed down from the resistance zone located between the key resistance level 0.8400 (former strong support from June, July and August) intersecting.
October 09, 2024 @ 21:57 +03:00
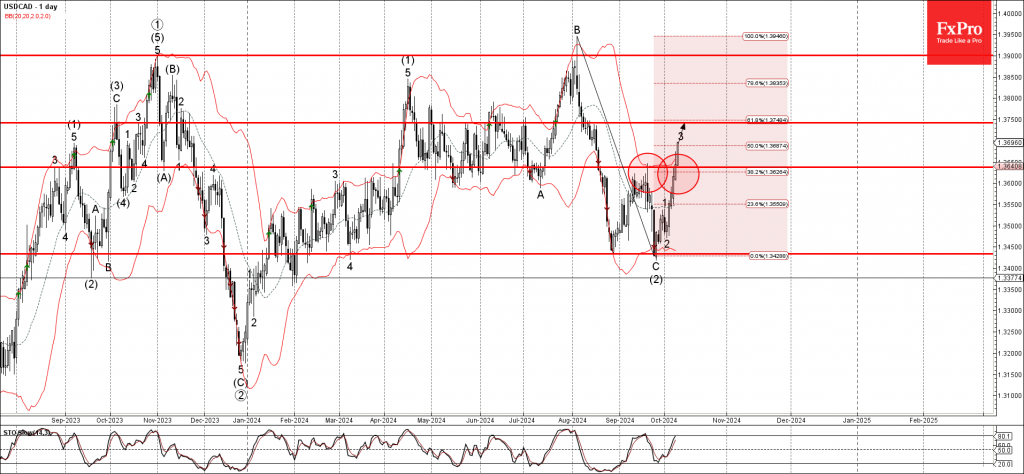
– USDCAD broke the resistance zone – Likely to rise to resistance level 1.3750 USDCAD currency pair recently broke the resistance zone located between the key resistance level 1.3635 (former monthly high from September) intersecting with the 38.2% Fibonacci correction.
October 09, 2024 @ 21:56 +03:00
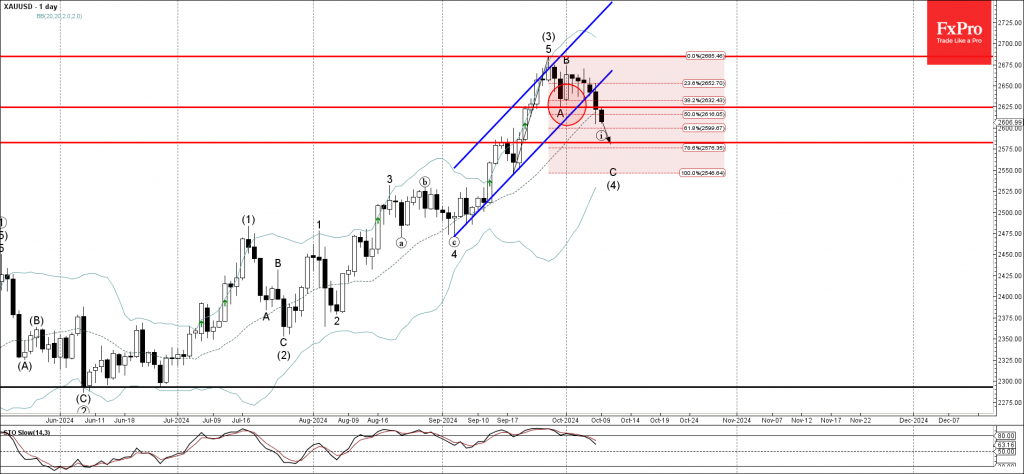
– Gold broke the support zone – Likely to fall support level 2580.00 Gold recently broke the support zone set between the support level 2625.00 (which stopped wave A at the end of September), the support trendline of the daily.
August 09, 2024 @ 10:35 +03:00
We are thrilled to announce that FxPro now offers two of the biggest US ETFs: SPY and QQQ! Trade from as little as 0.01 lots. Dive into the world of ETF CFDs with FxPro today! 📈 Marketing communication, not trading.
June 03, 2024 @ 17:03 +03:00
Nvidia (NVDA) has announced a 10-for-1 stock split. 📅 The split is set to happen after the US stock market closes on June 7, with trading on a post-split basis starting on June 10. Key points to note: At FxPro,.
March 22, 2021 @ 10:15 +03:00
The deep anger among some pro-British unionists in Northern Ireland over post-Brexit trade barriers that cut it off from the rest of the United Kingdom is emblazoned along the road from Belfast to the mainly Protestant port town of Larne..
January 06, 2021 @ 11:04 +03:00
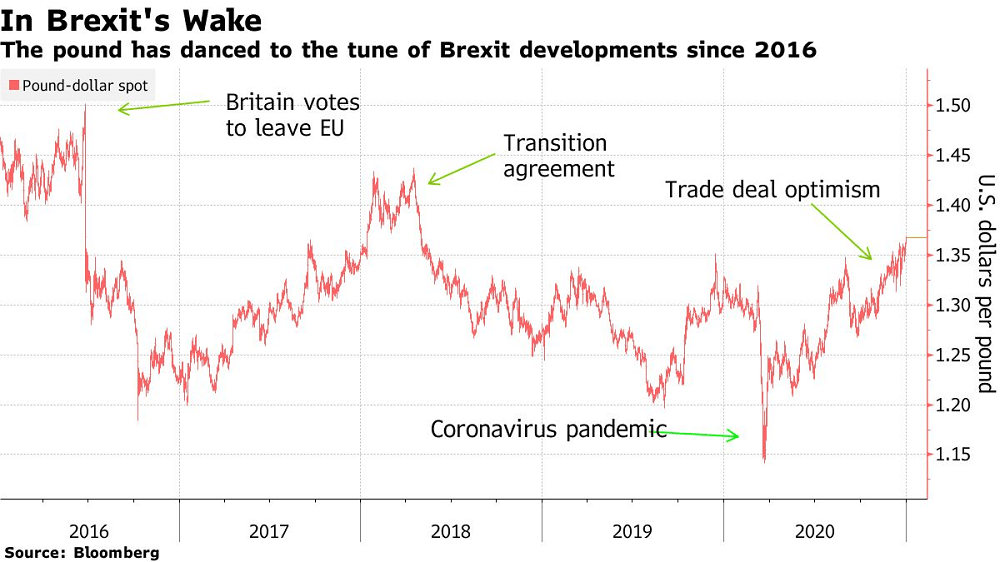
The pound’s Brexit deal honeymoon looks well and truly over, with the currency off to the worst start to the year among its Group-of-10 peers. Allianz Global Investors has taken a short position on sterling against the euro, citing the.






 GBP | BOE Governor Andrew Bailey Speaks