


Technical analysis - Page 2
October 13, 2026
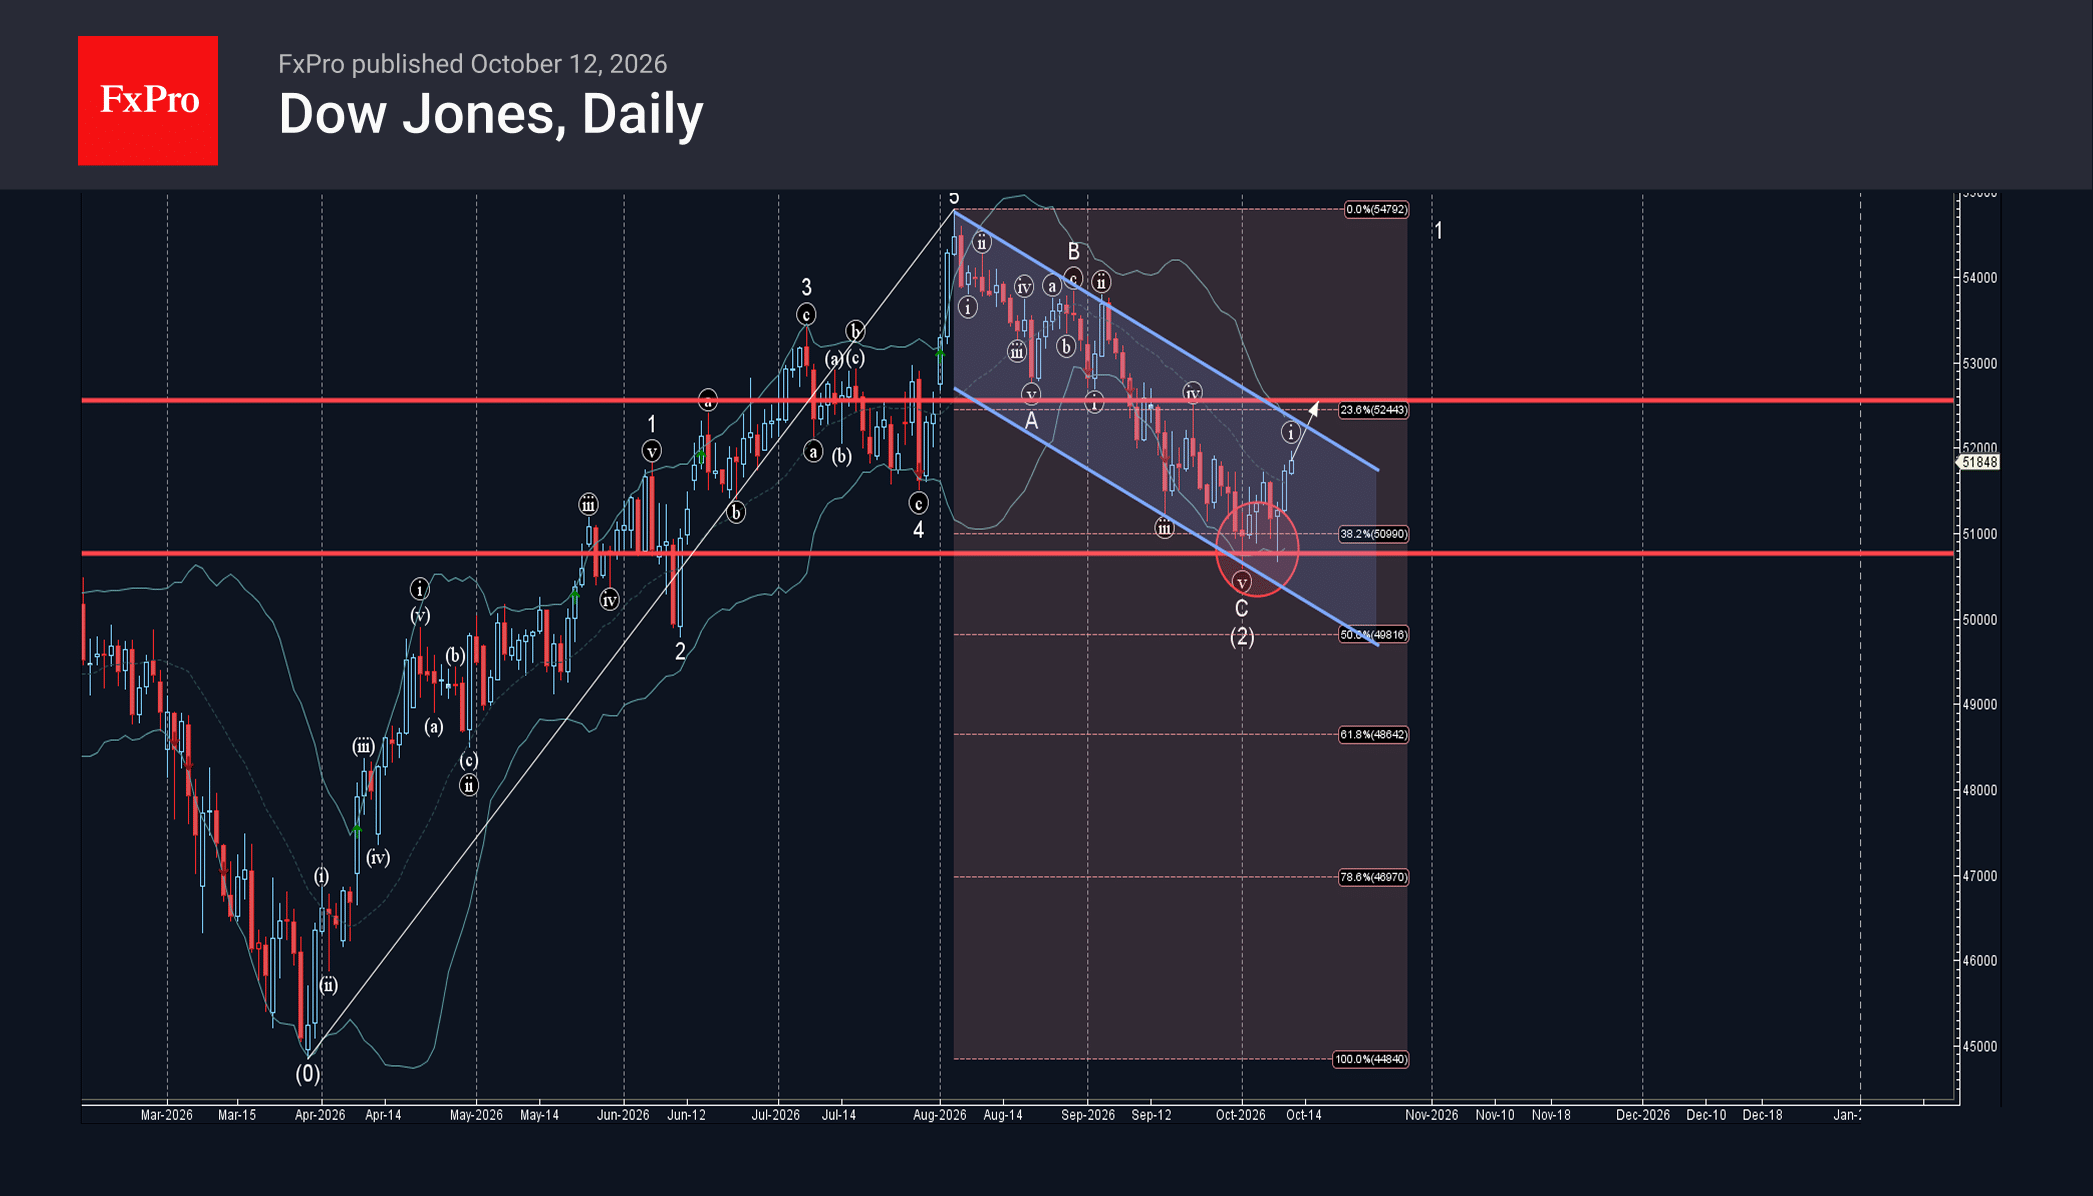
Dow Jones Index: ⬆️ Buy – Dow Jones Index reversed from support zone – Likely to rise to resistance level 52550.00 Dow Jones Index recently reversed up from the support zone between the support level 50750.00, support trendline of the.
October 13, 2026
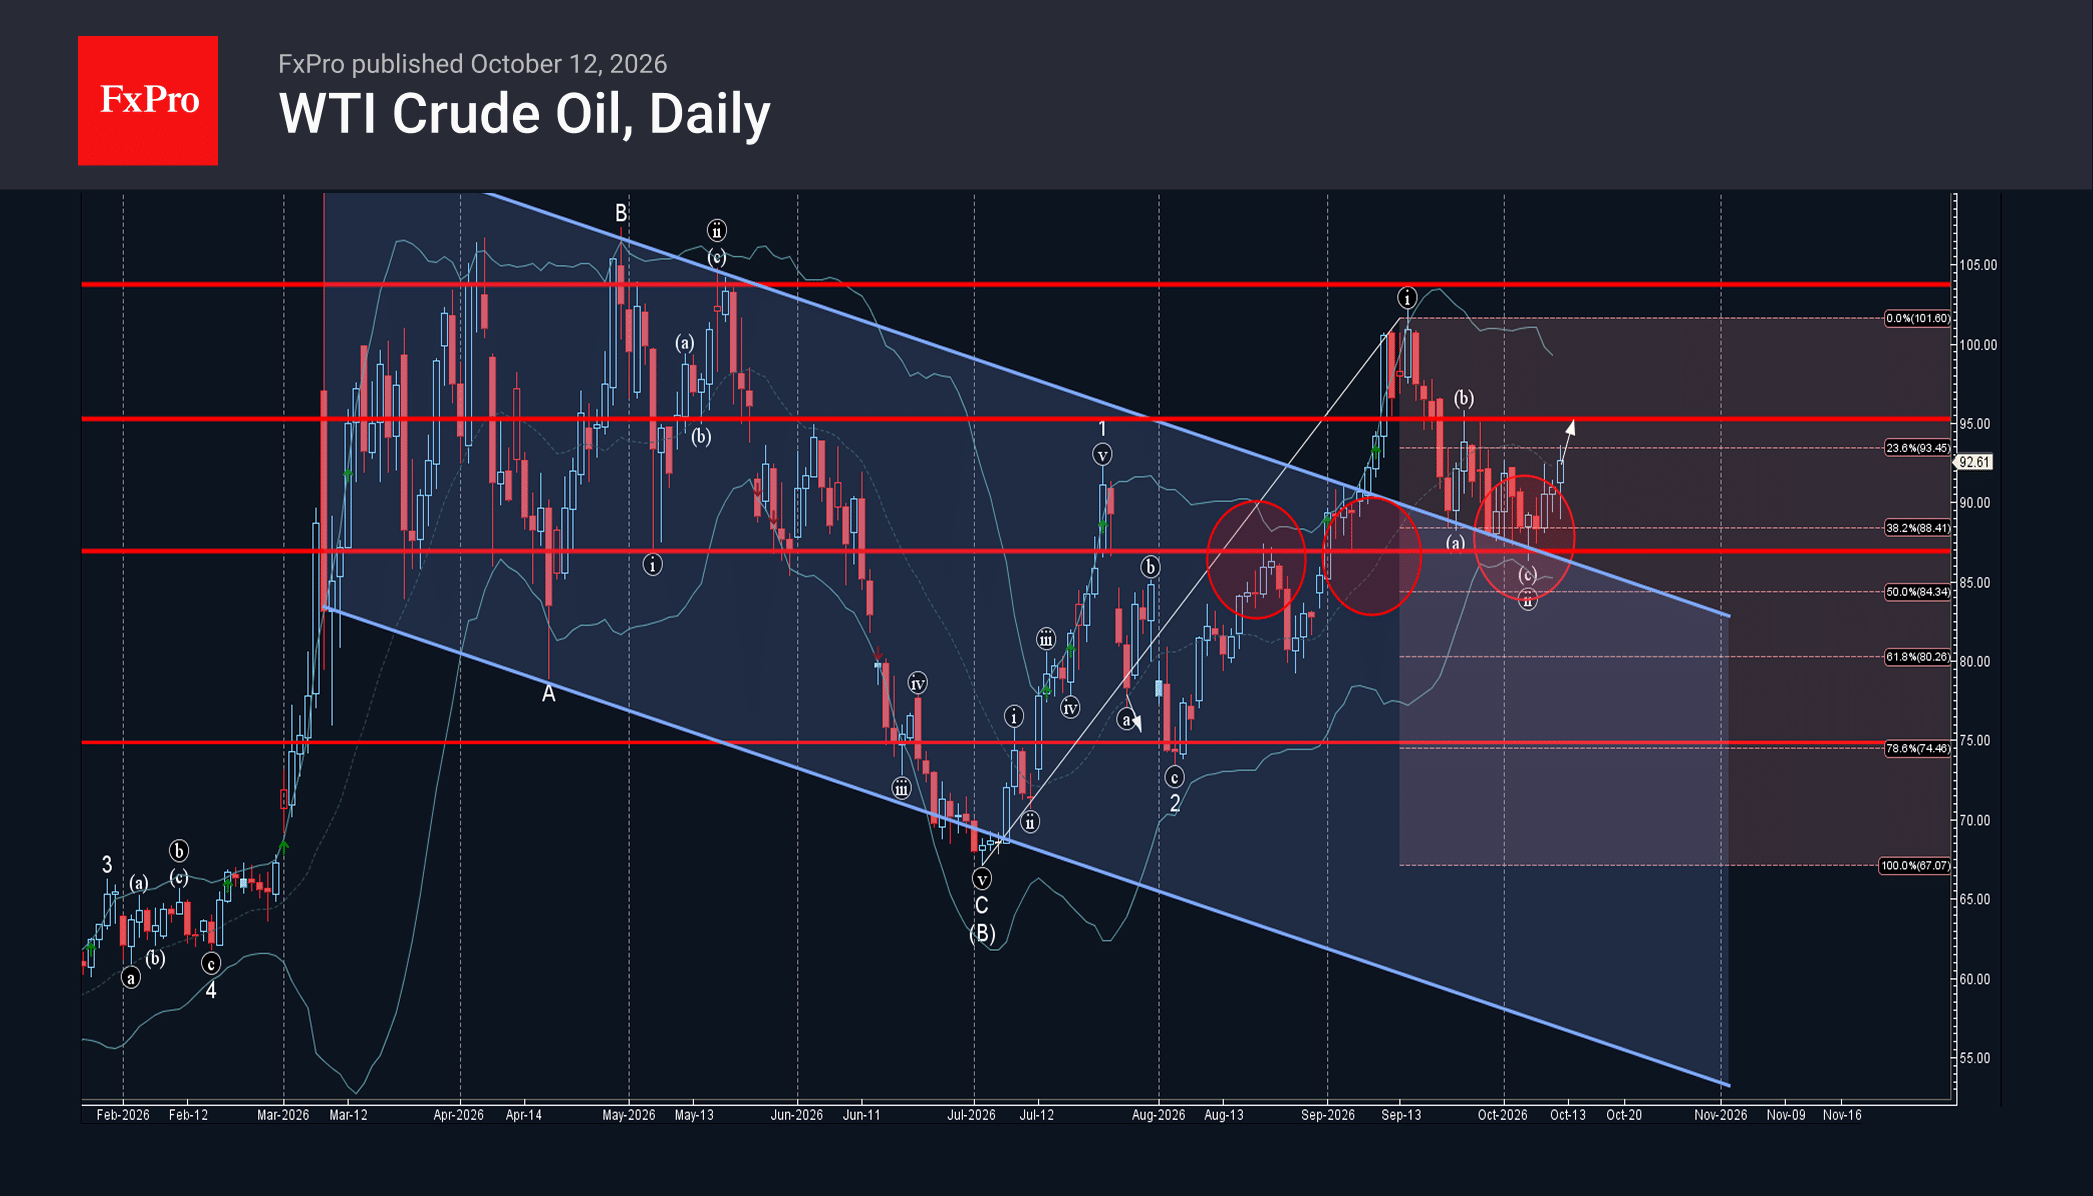
WTI Crude Oil: ⬆️ Buy – WTI Crude Oil reversed from support zone – Likely to rise to resistance level 95.00 WTI Crude Oil recently reversed up from the support zone between the key support level 87.00 (former resistance from.
October 13, 2026
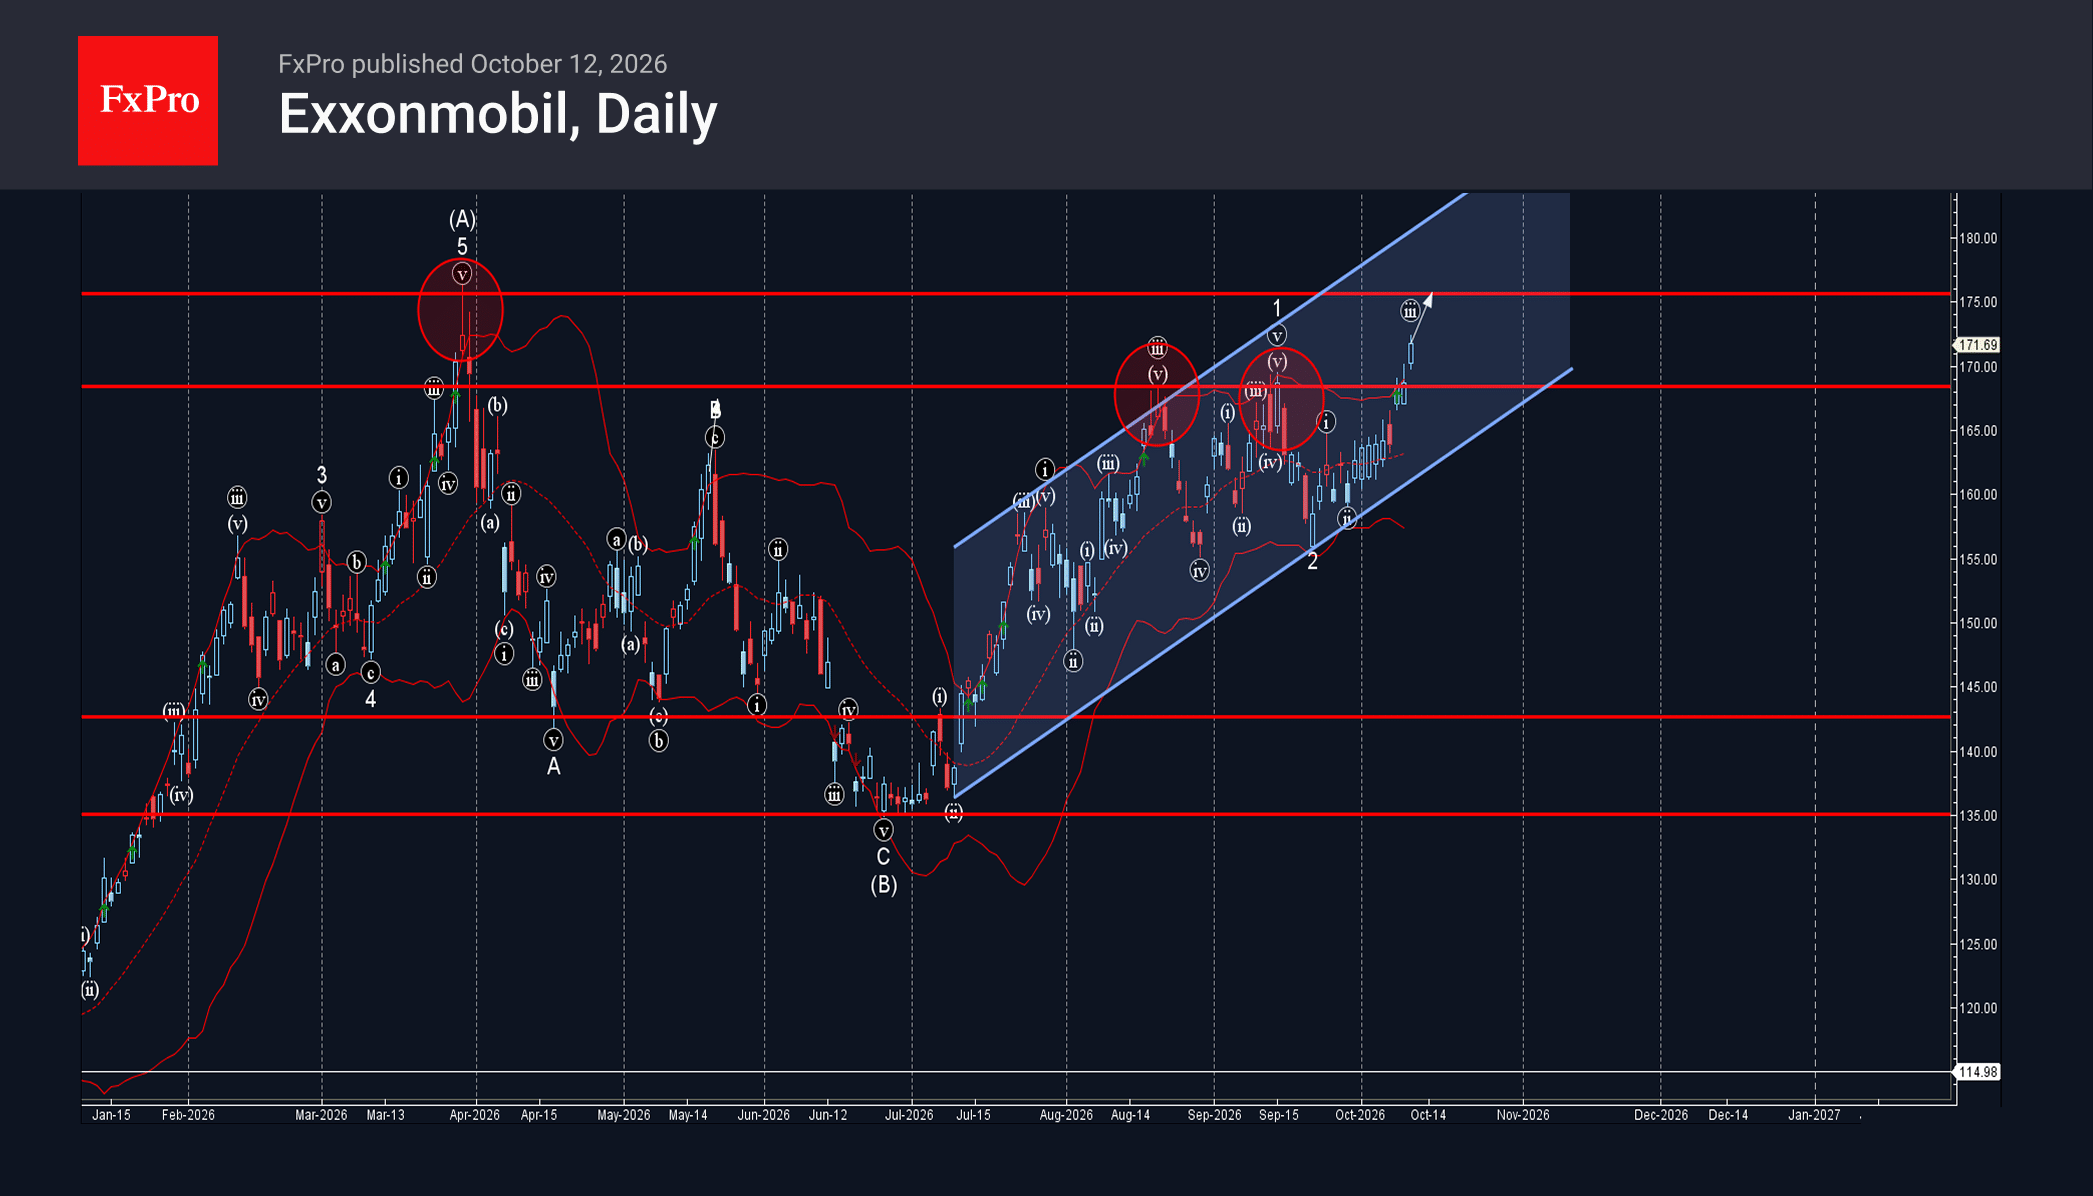
Exxon Mobil: ⬆️ Buy – Exxon Mobil broke key resistance level 168.50 – Likely to rise to resistance level 175.50 Exxon Mobil recently broke above the key resistance level 168.50, which previously stopped wave (v) in the middle of August.
October 13, 2026
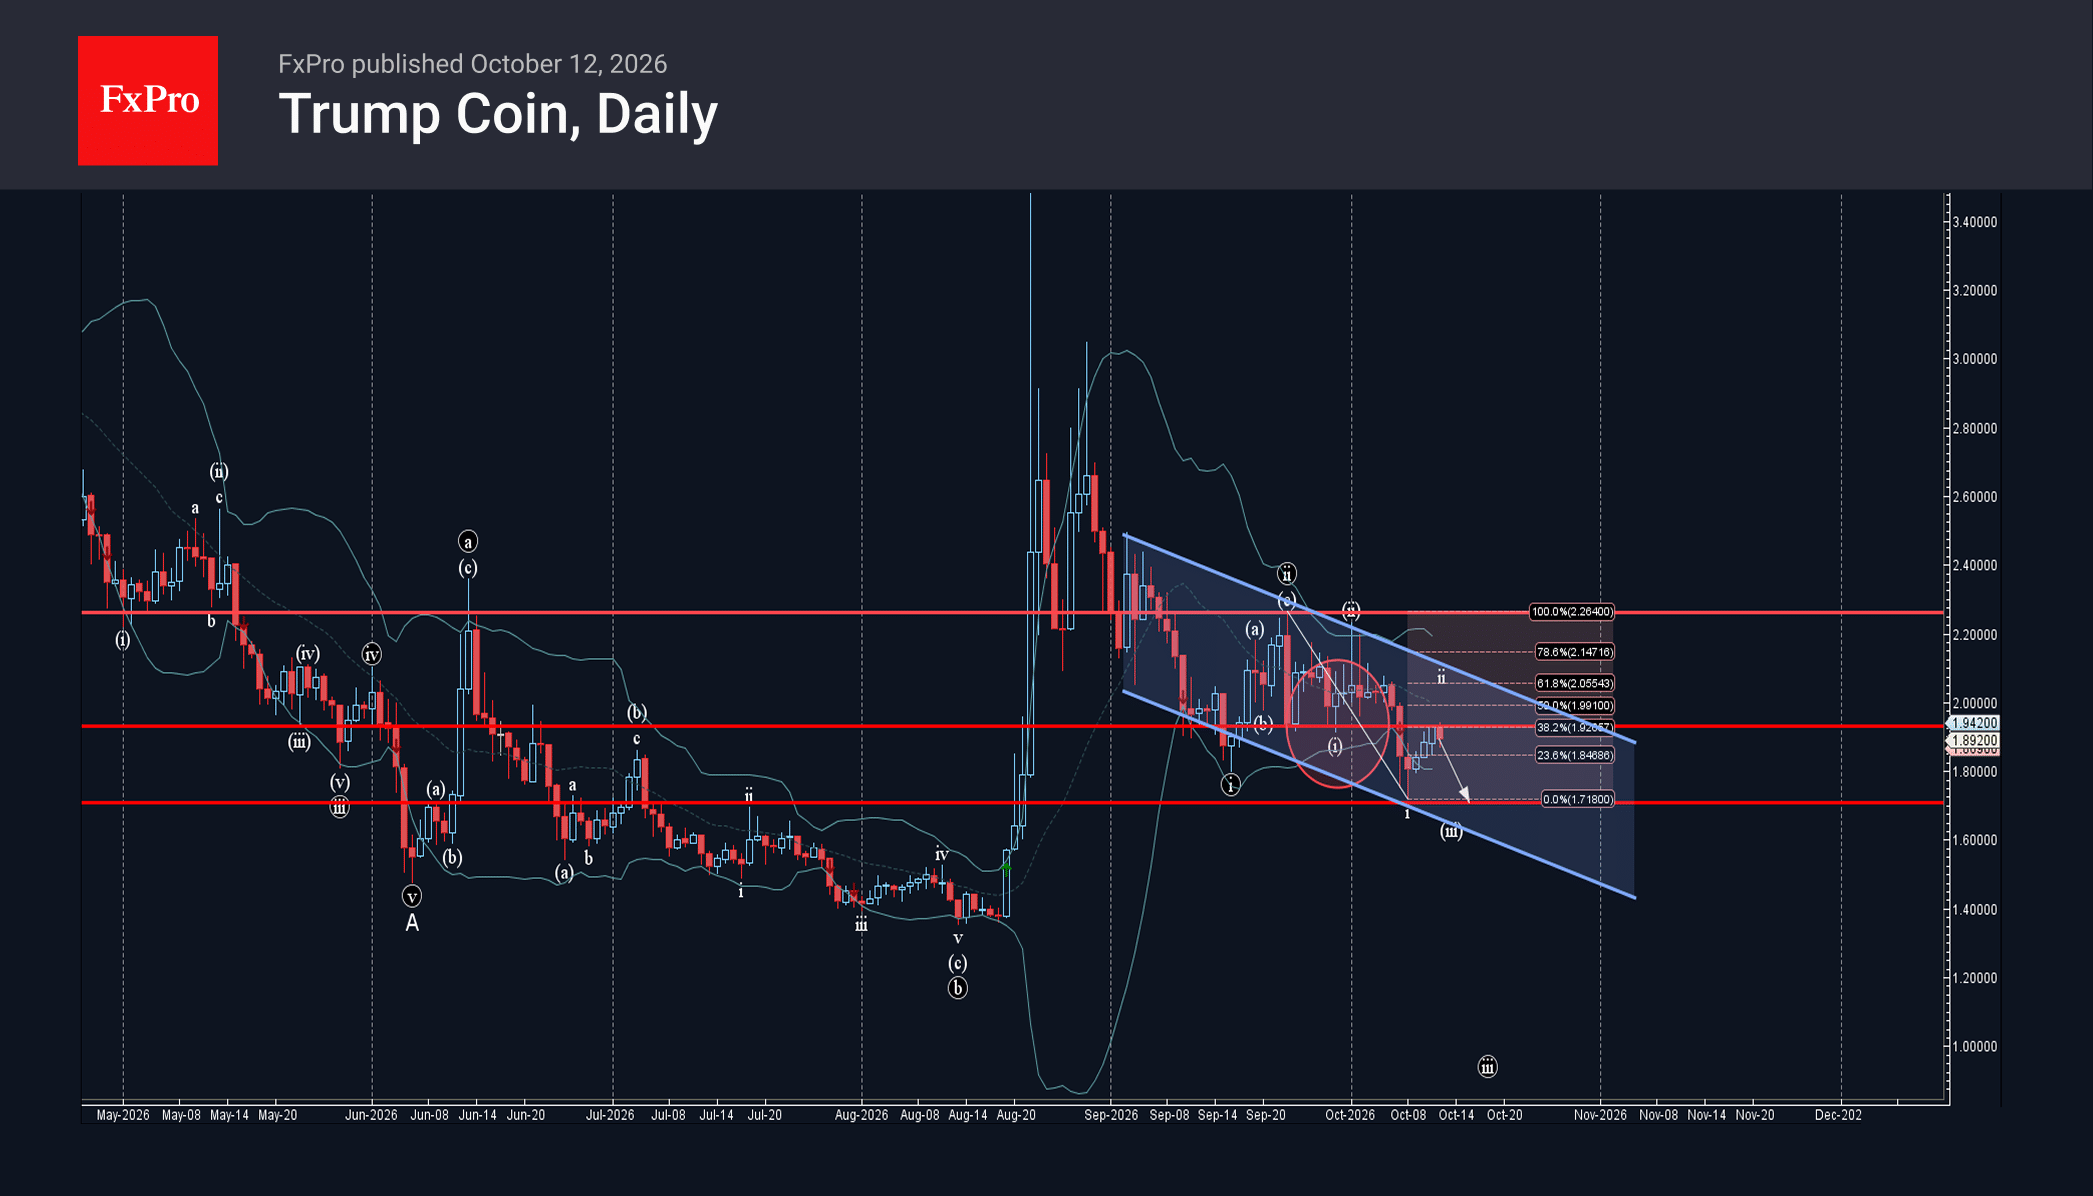
Trump Coin: ⬇️ Sell – Trump Coin reversed from resistance zone – Likely to fall to support level 1.7100 Trump Coin recently reversed down from the resistance zone between the resistance level 1.9300 (former support from the end of September,.
October 9, 2026
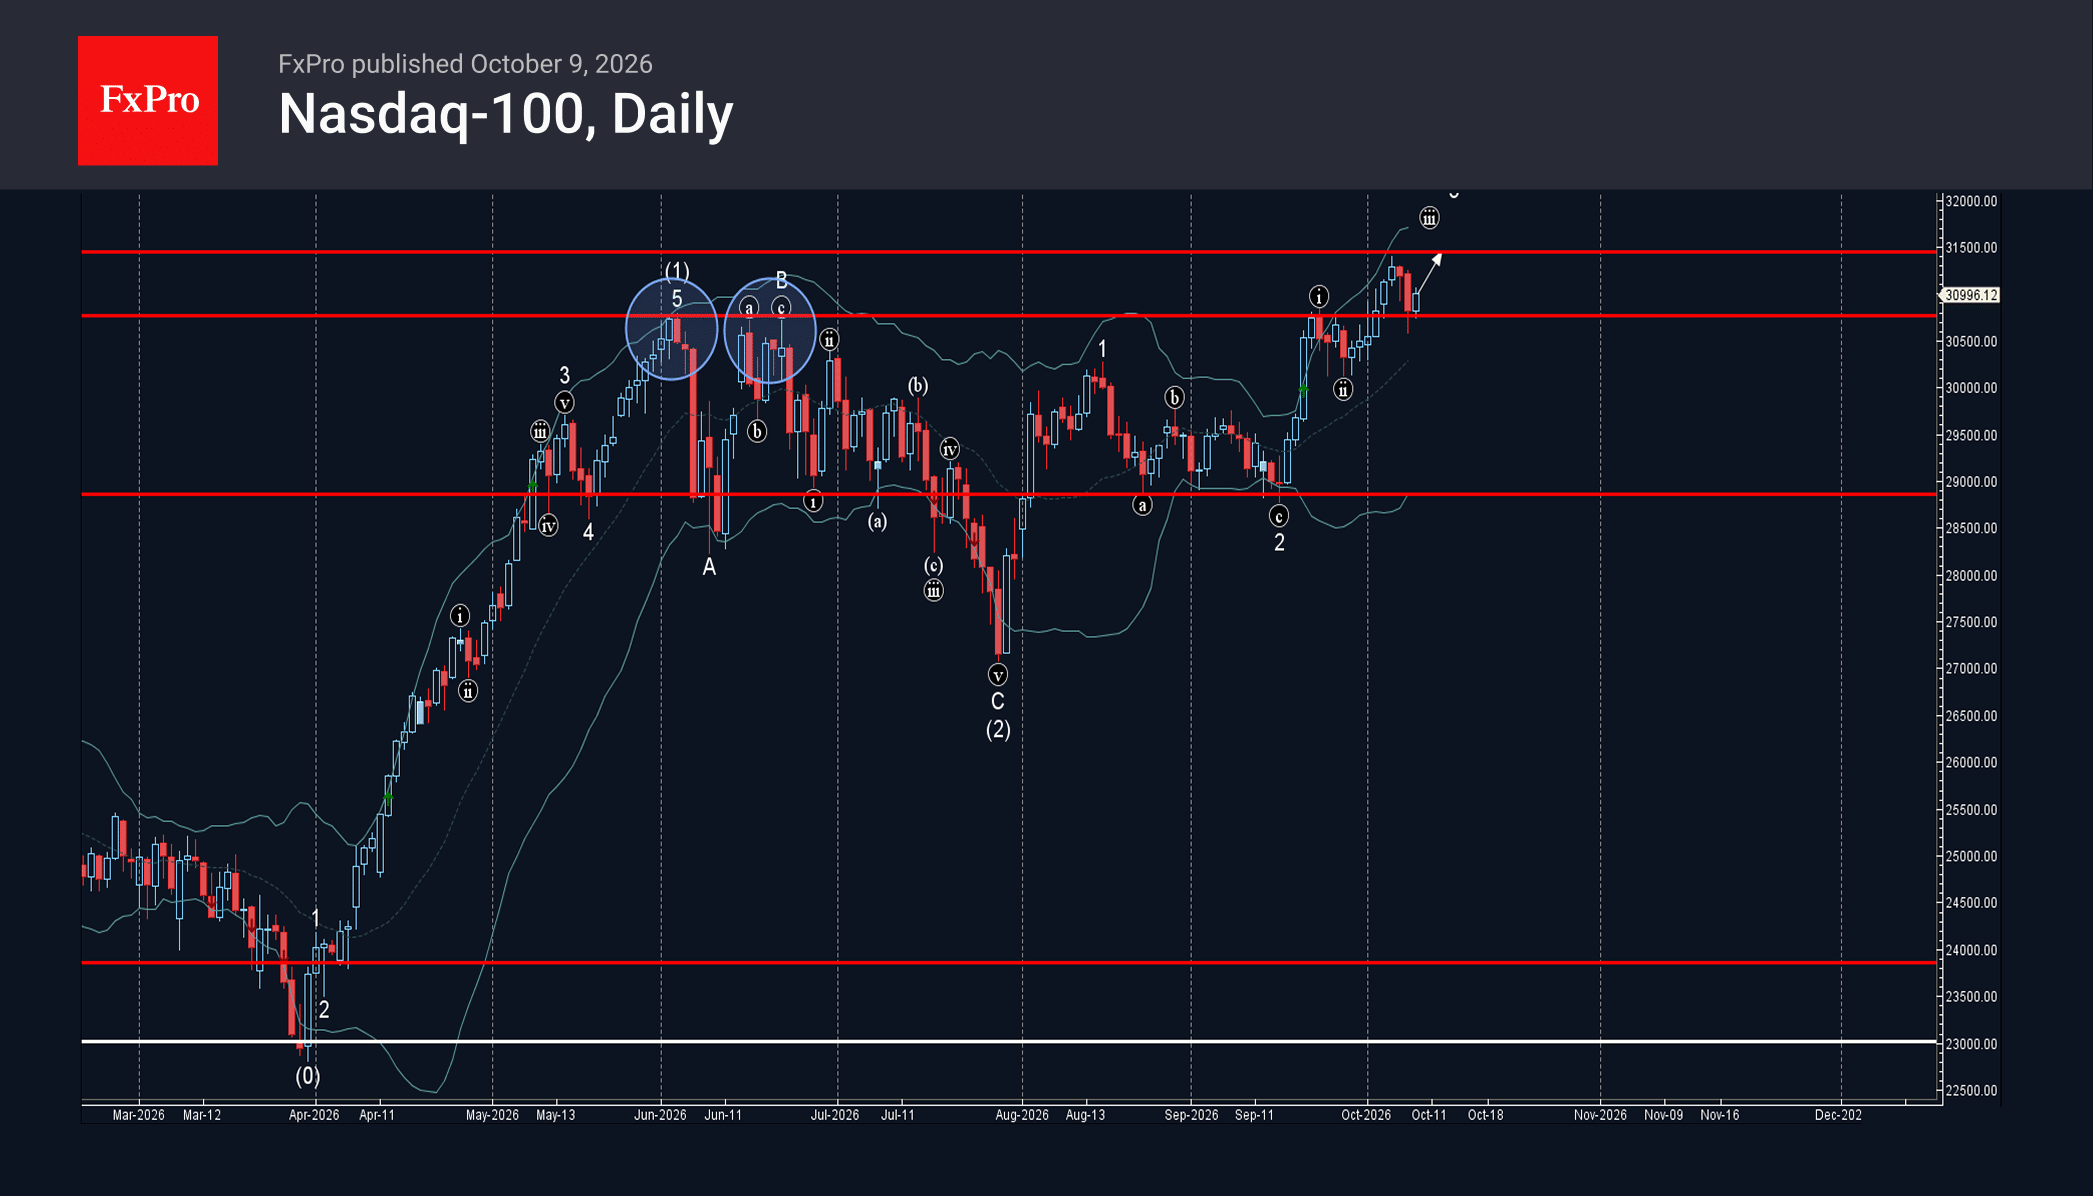
Nasdaq-100 Index: ⬆️ Buy – Nasdaq-100 Index reversed from support level 30800.00 – Likely to rise to resistance level 31500.00 Nasdaq-100 Index recently reversed up from the support level 30800.00 – former strong resistance, which stopped wave (1) at the.
October 9, 2026
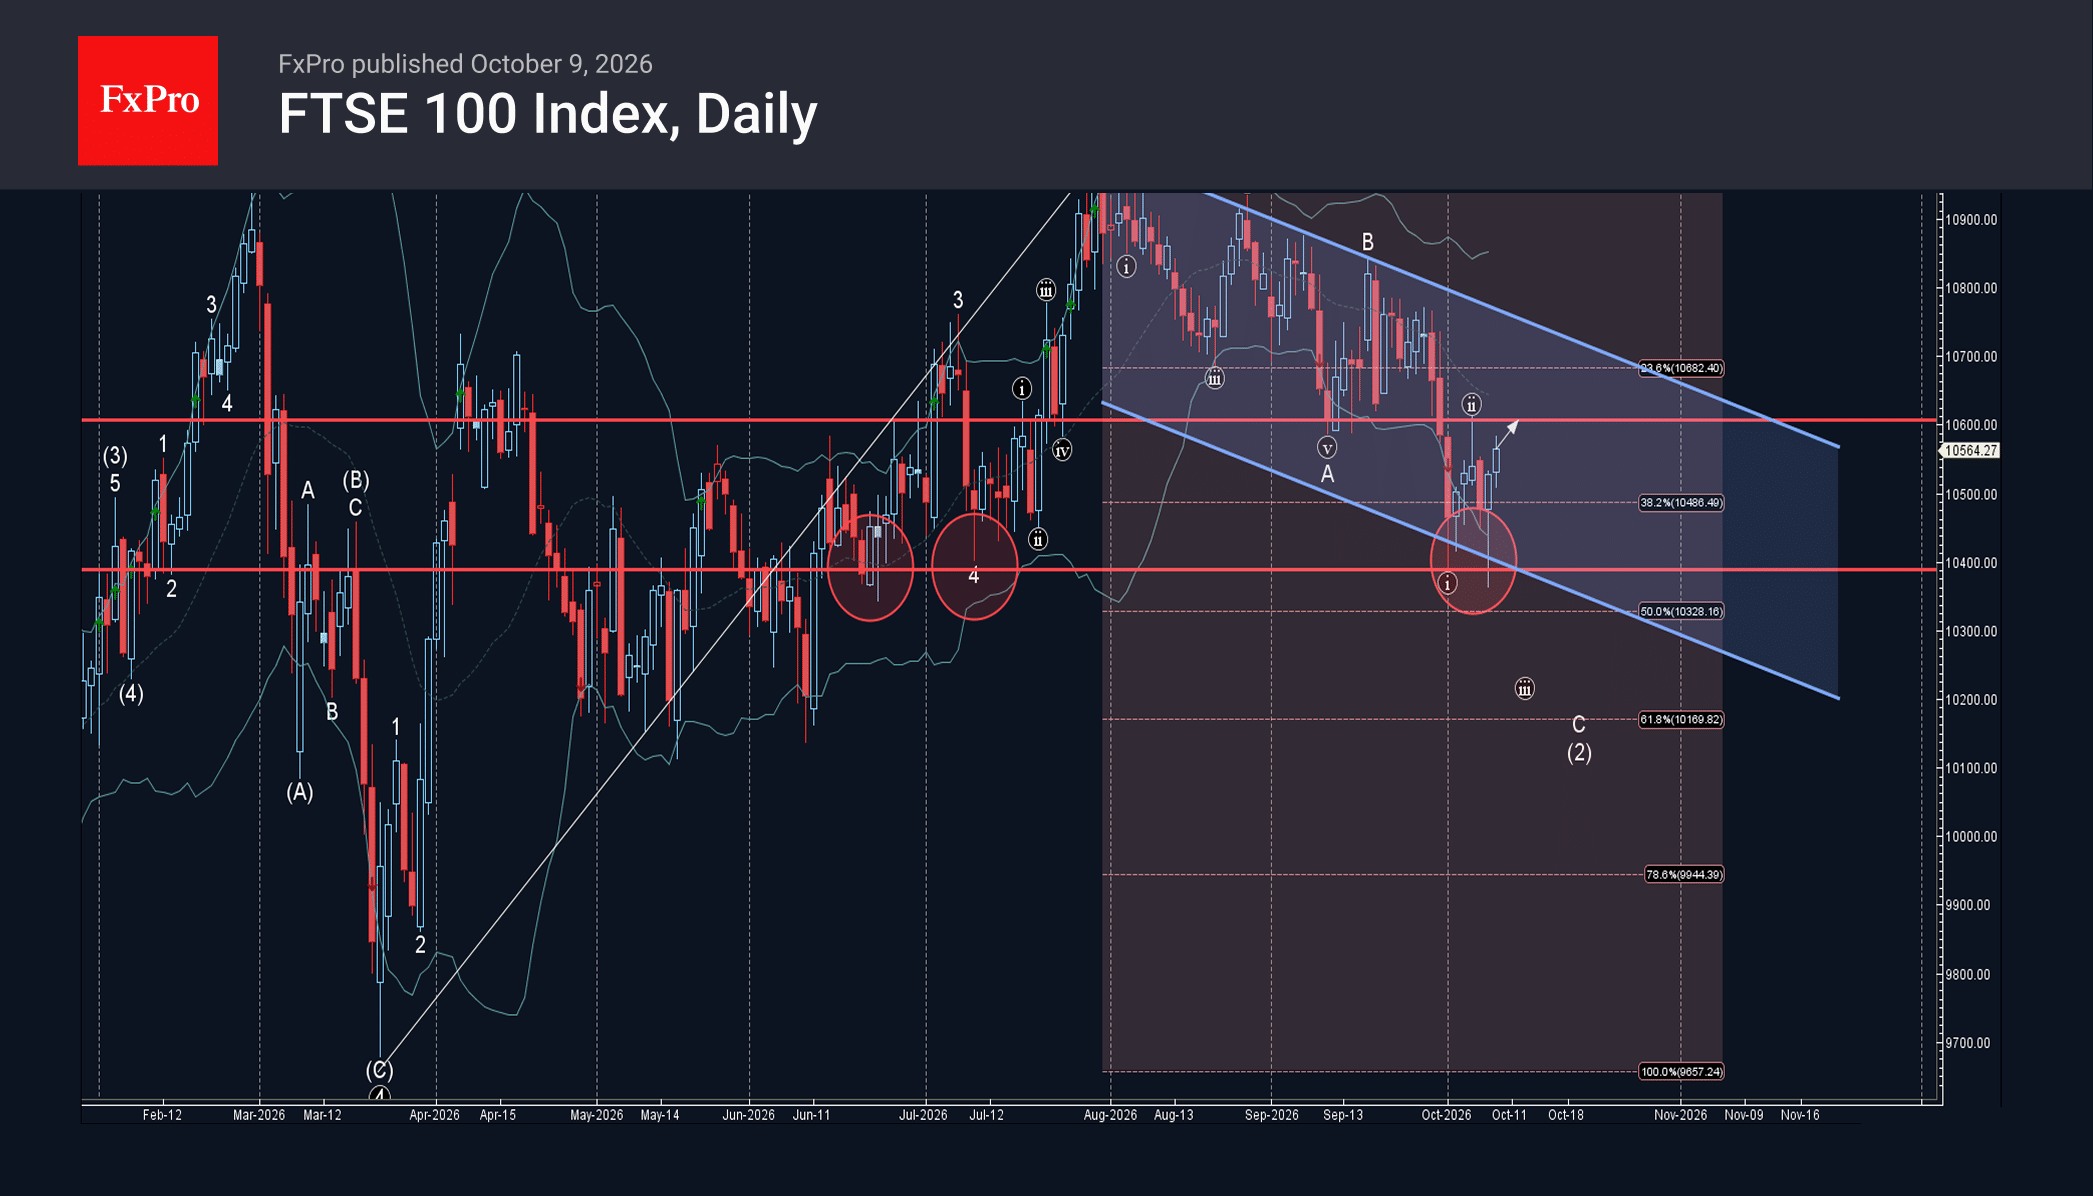
FTSE 100: ⬆️ Buy – FTSE 100 reversed from support zone – Likely to rise to resistance level 10600.00 FTSE 100 index recently reversed up from the support zone between the key support level 10400.00 (which has been reversing the.
October 9, 2026
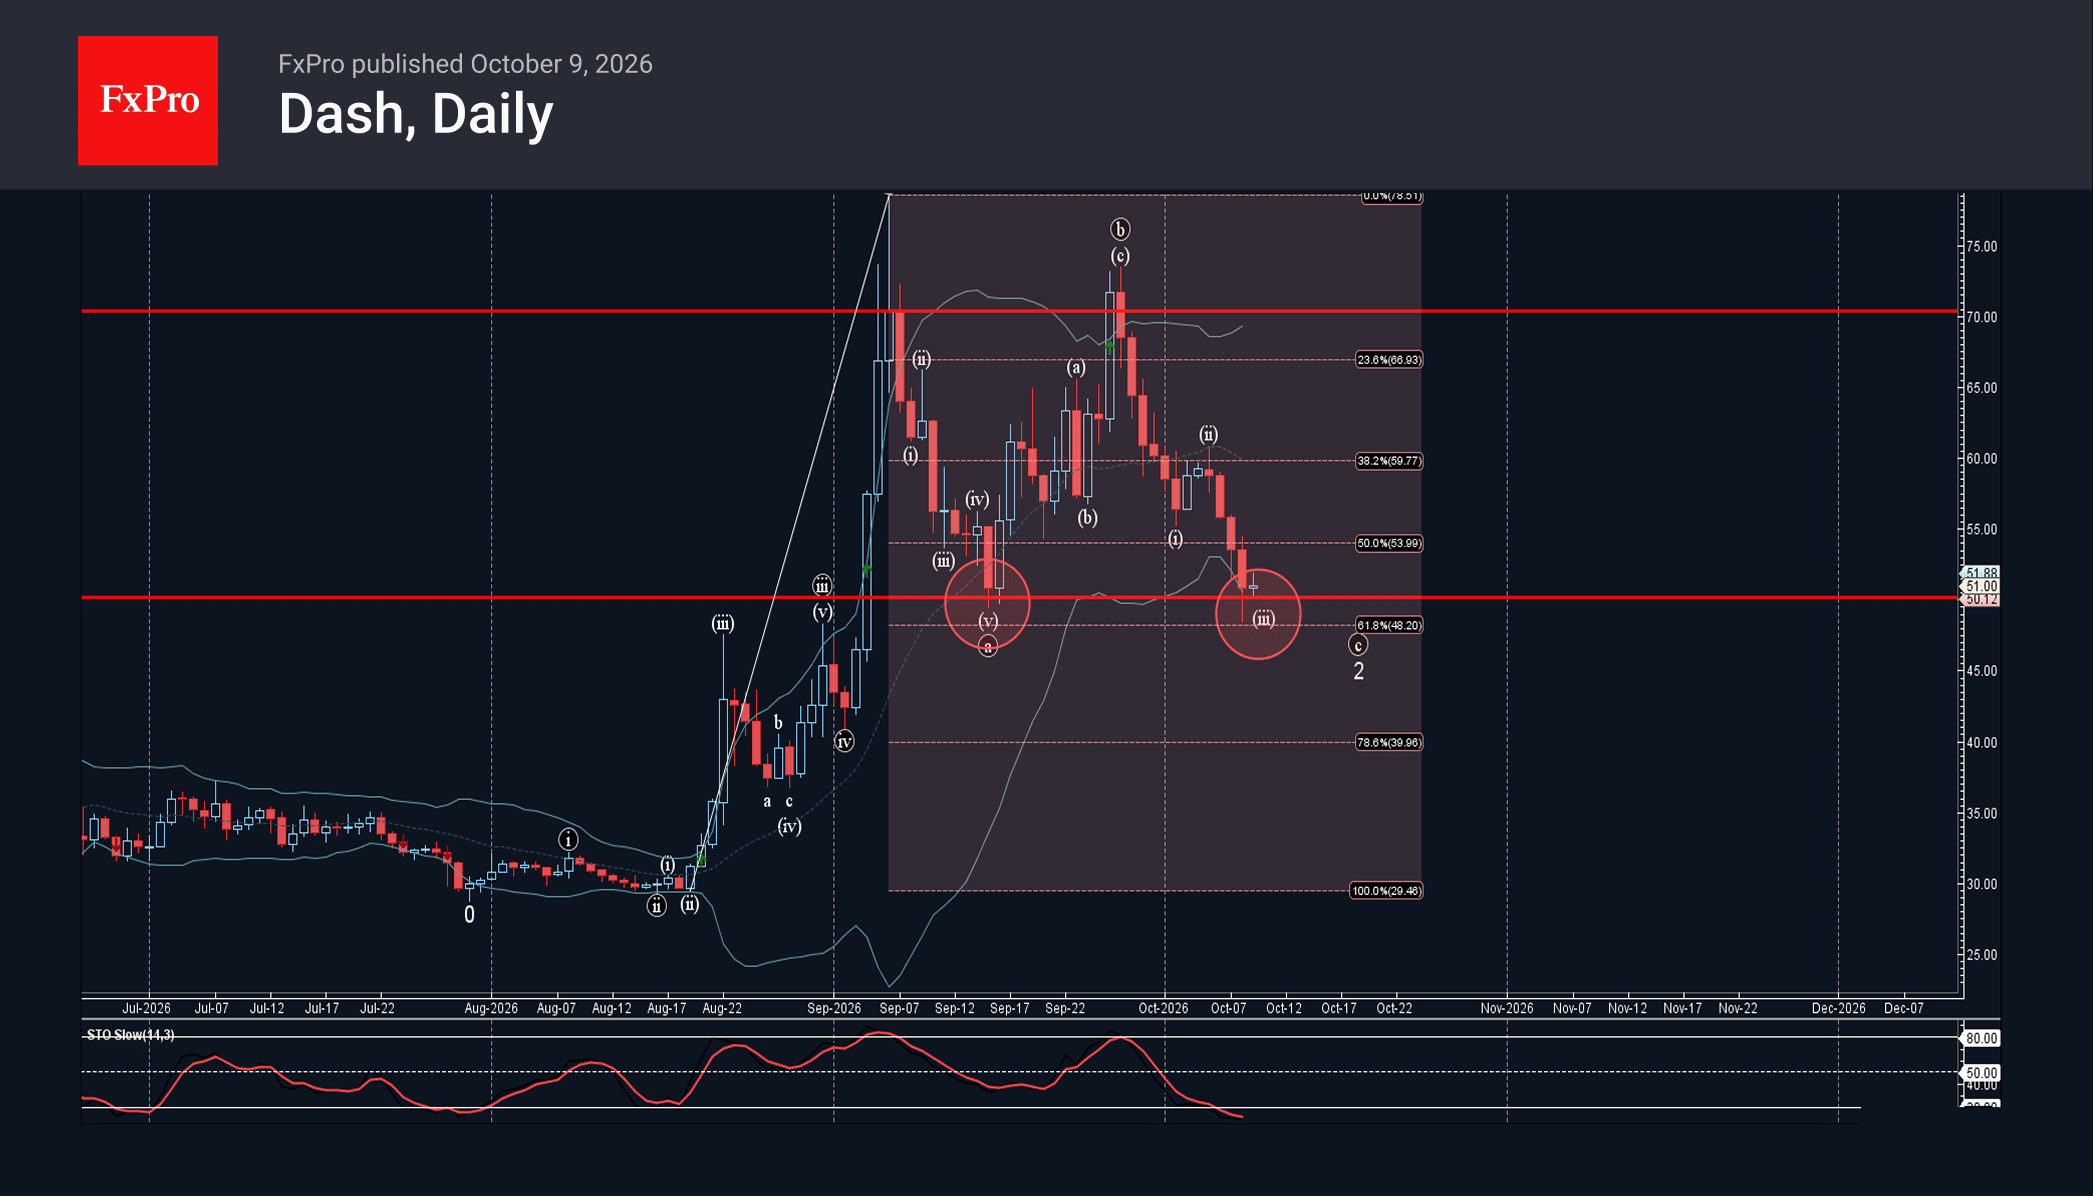
Dash: ⬆️ Buy – Dash reversed from support level 50.00 – Likely to rise to resistance level 55.00 Dash cryptocurrency today reversed up from the support area between the round support level 50.00 (which stopped wave a in the middle.
October 9, 2026
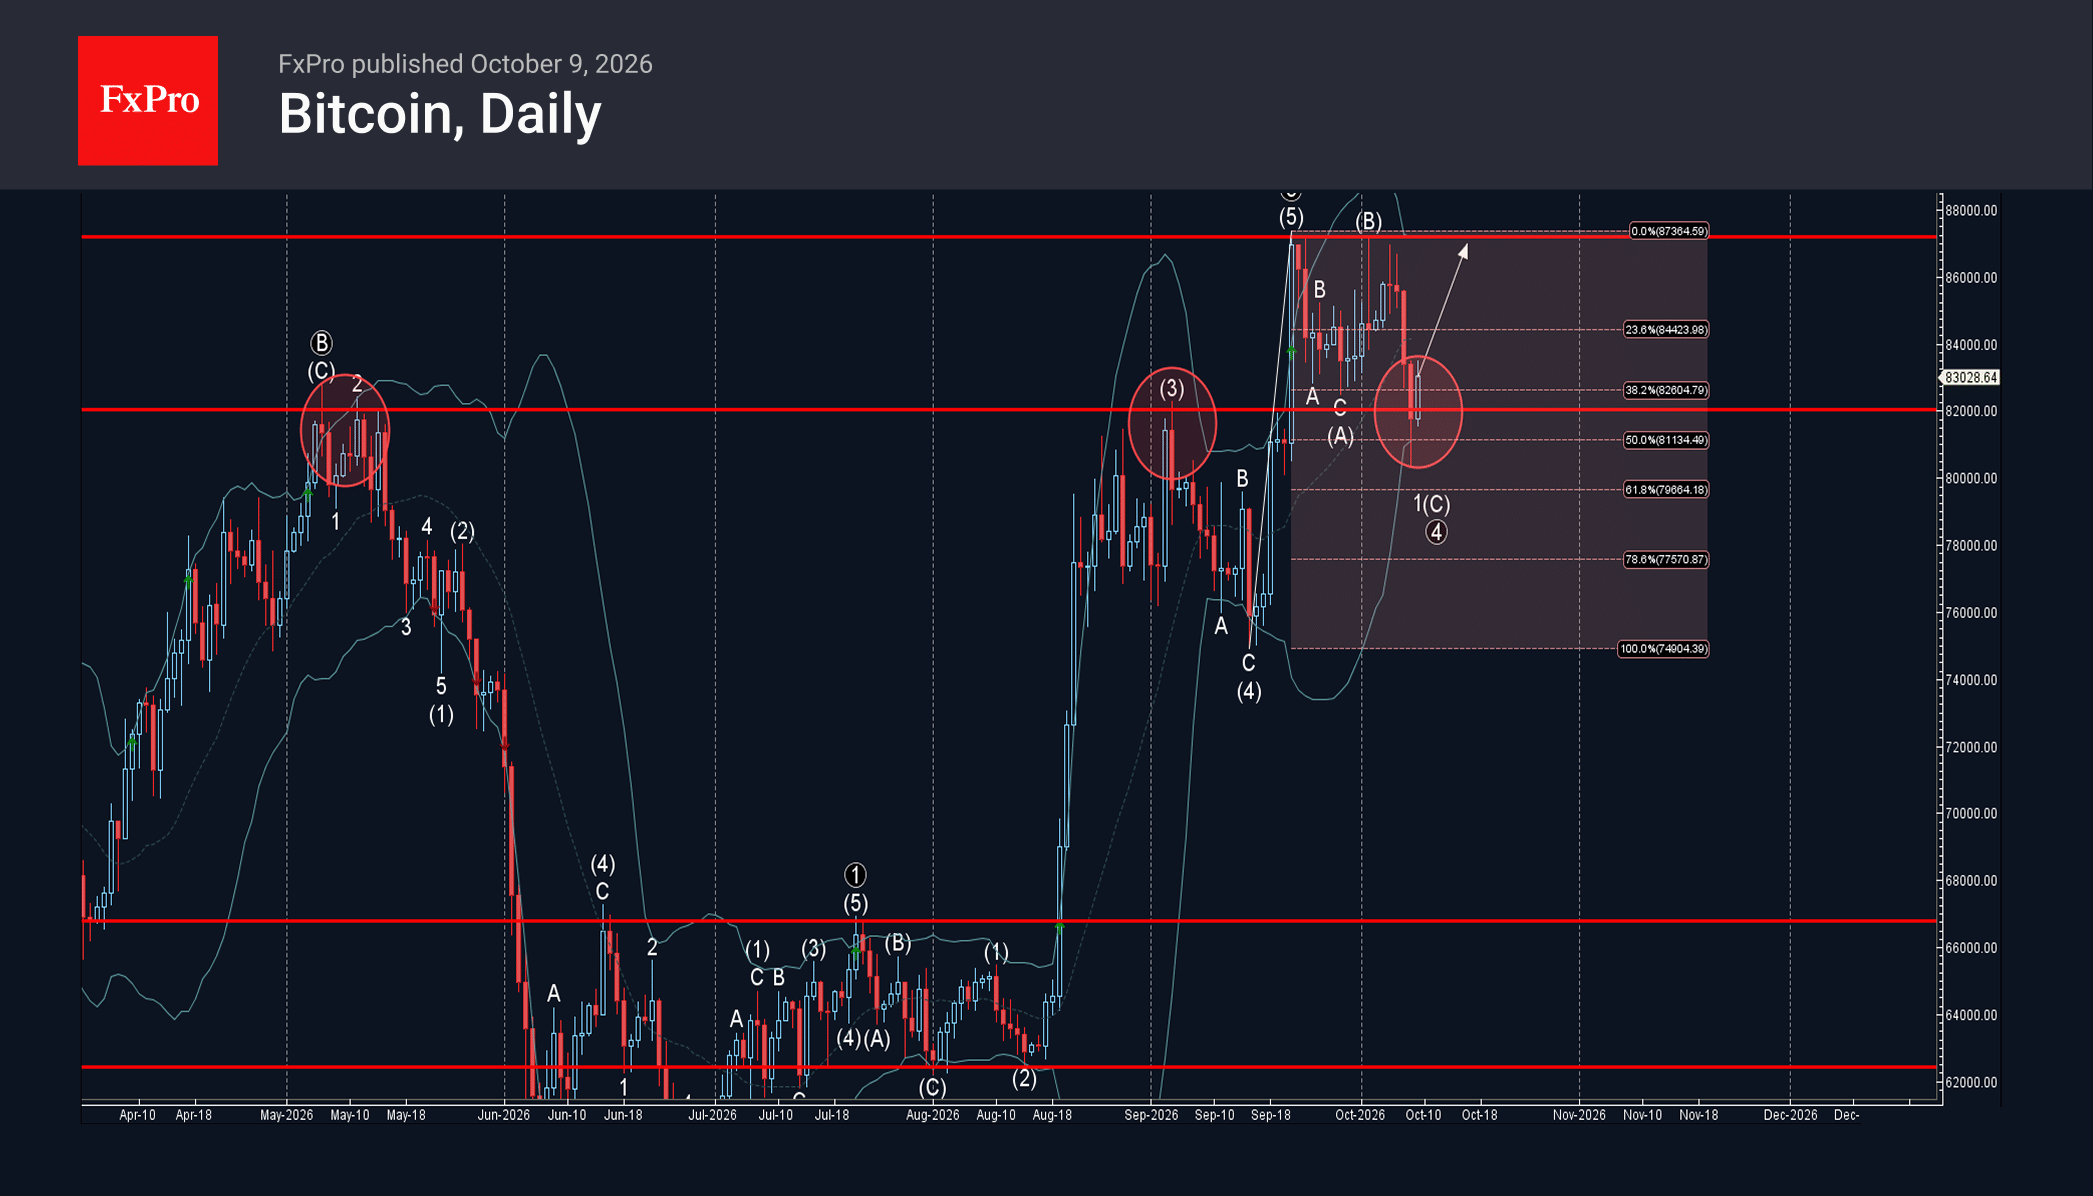
Bitcoin: ⬆️ Buy – Bitcoin reversed from key support level 82000.00 – Likely to rise to resistance level 87185.00 Bitcoin cryptocurrency recently reversed up from the support zone between the pivotal support level 82000.00 (former resistance from May and the.
October 9, 2026
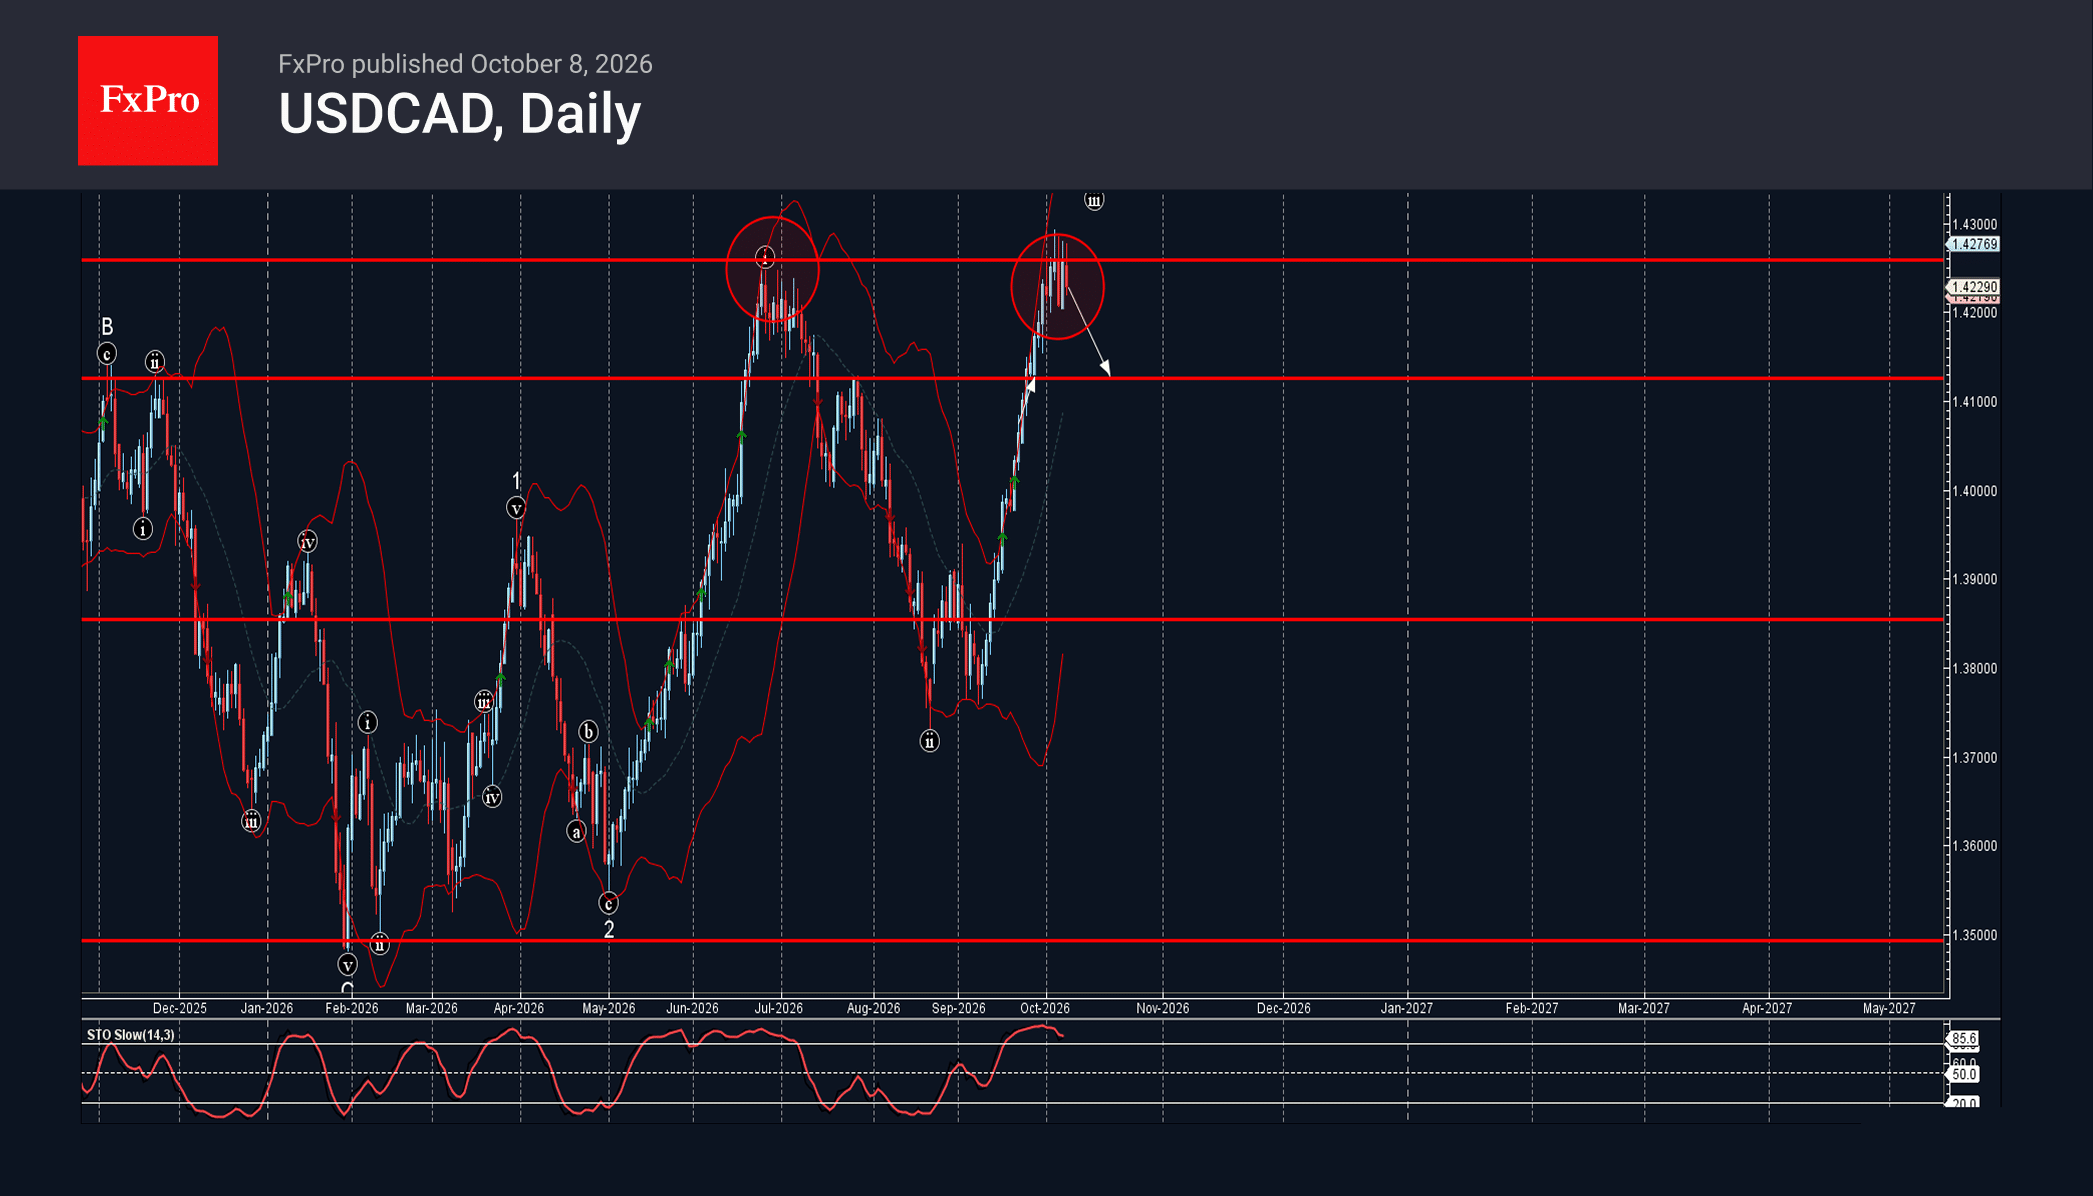
USDCAD: ⬇️ Sell – USDCAD reversed from resistance zone – Likely to fall to support level 1.4125 USDCAD currency pair recently reversed down from the resistance zone between the strong resistance level 1.4260 (which stopped wave i at the end.
October 8, 2026
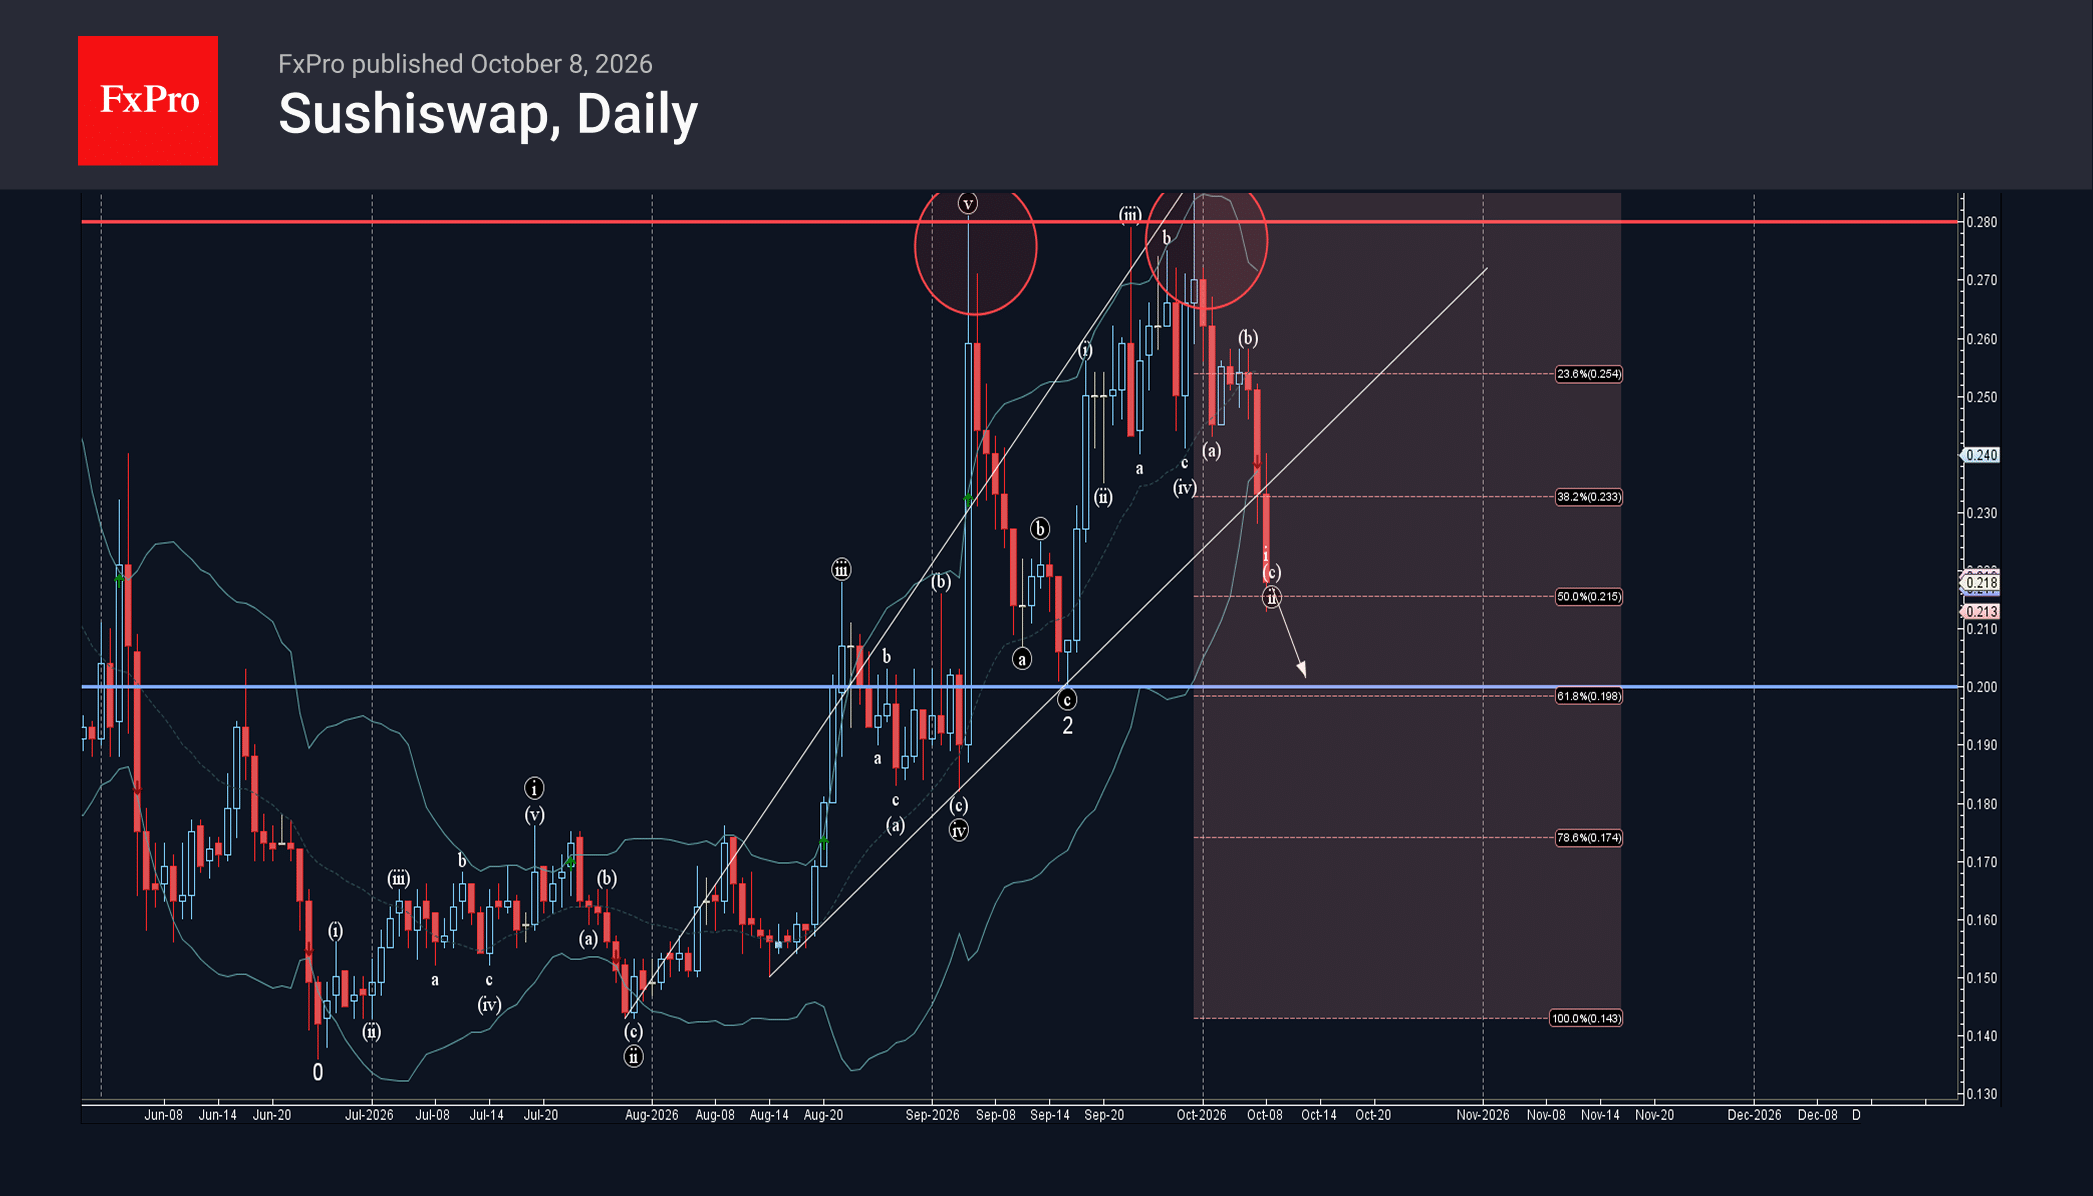
SushiSwap: ⬇️ Sell – SushiSwap broke support trendline – Likely to fall to support level 0.2000 SushiSwap cryptocurrency recently broke the support trendline from the middle of August, after the earlier downward reversal from the resistance level 0.2800 (which stopped.
October 8, 2026
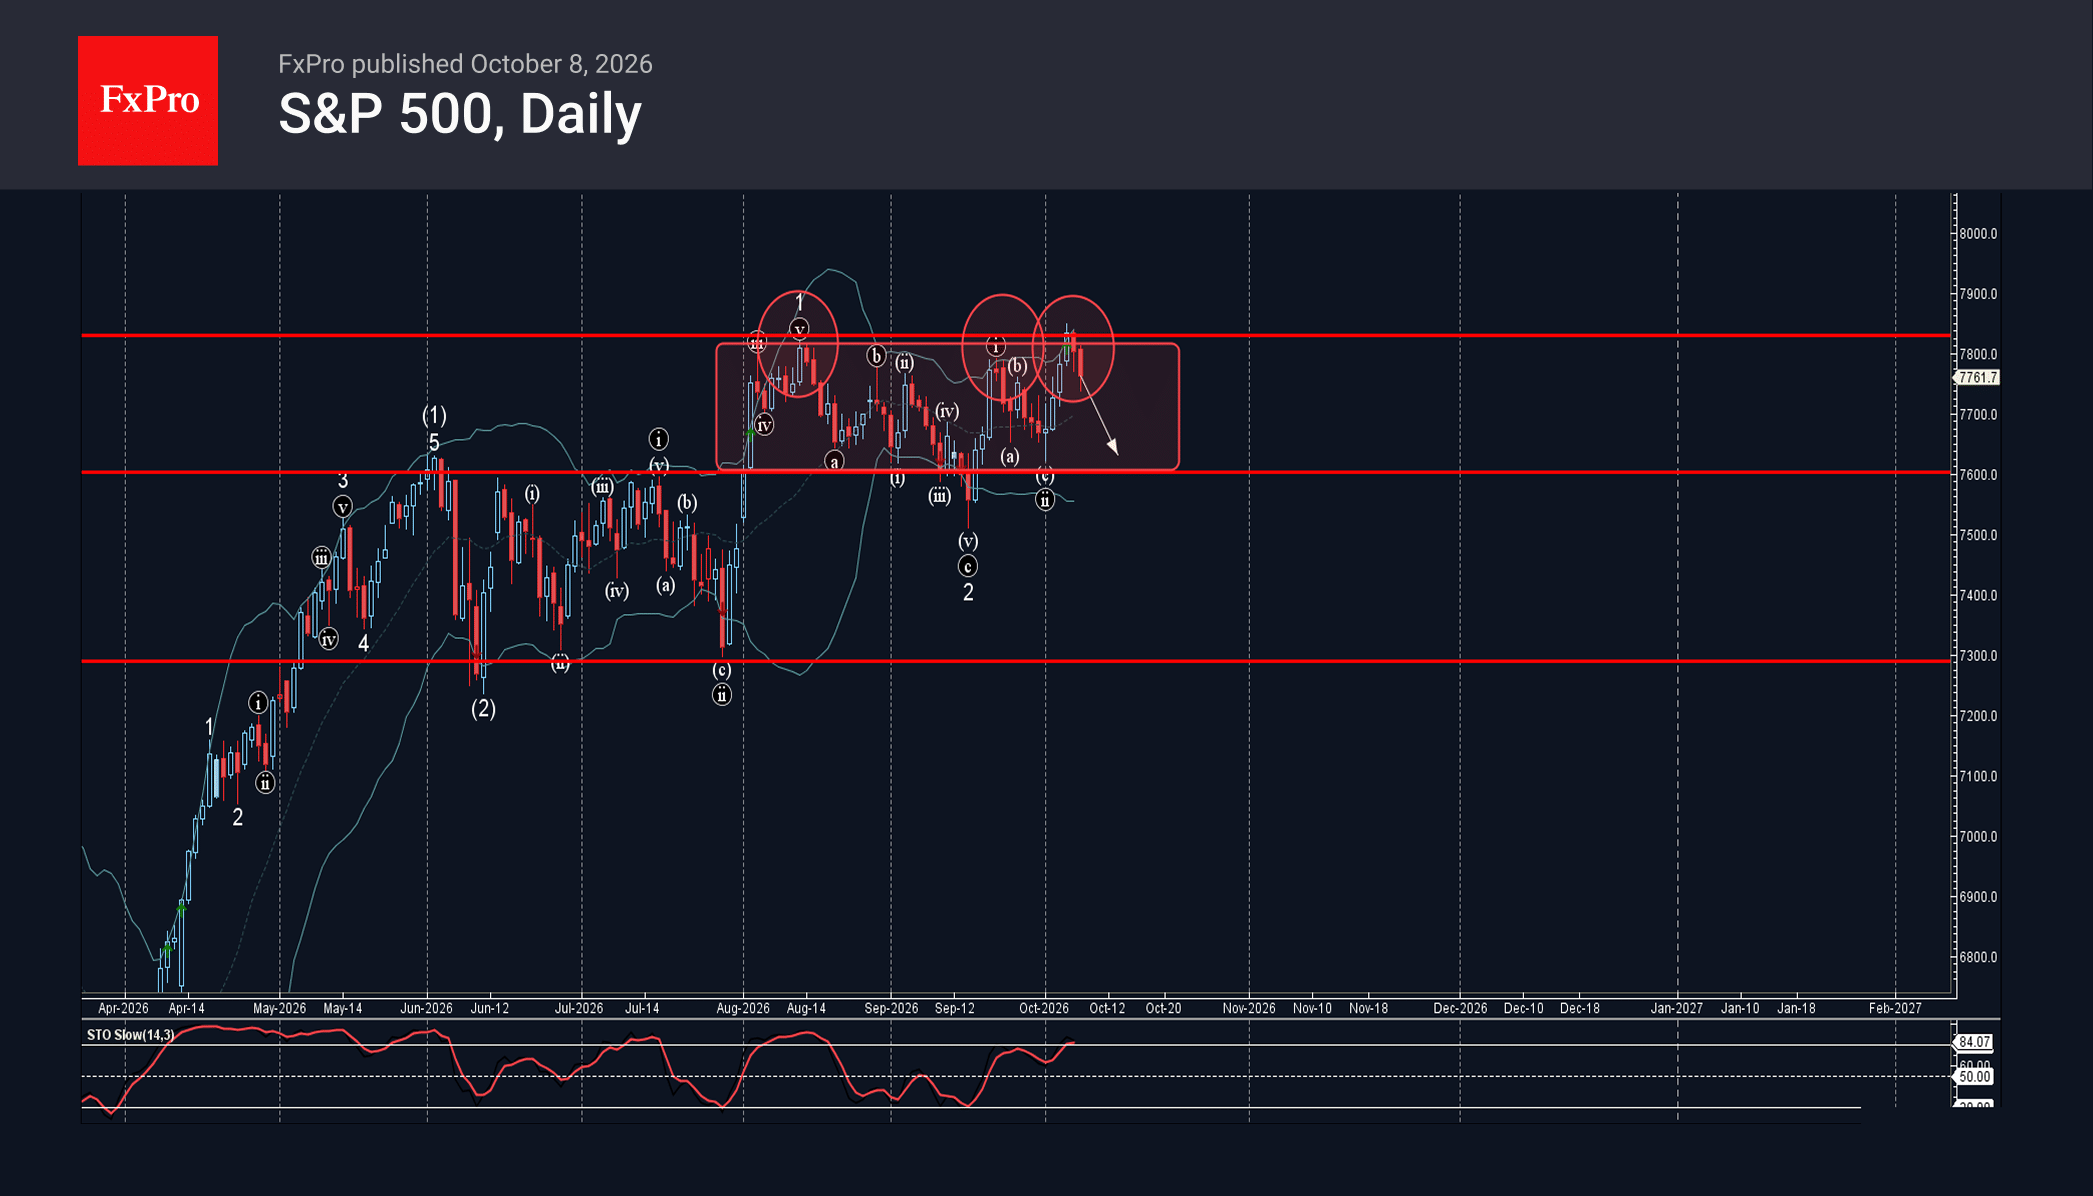
S&P 500: ⬇️ Sell – S&P 500 reversed from resistance zone – Likely to fall to support level 7600.00 S&P 500 index recently reversed down from the resistance zone between the resistance level 7830.00 (upper border of the sideways price.
October 8, 2026
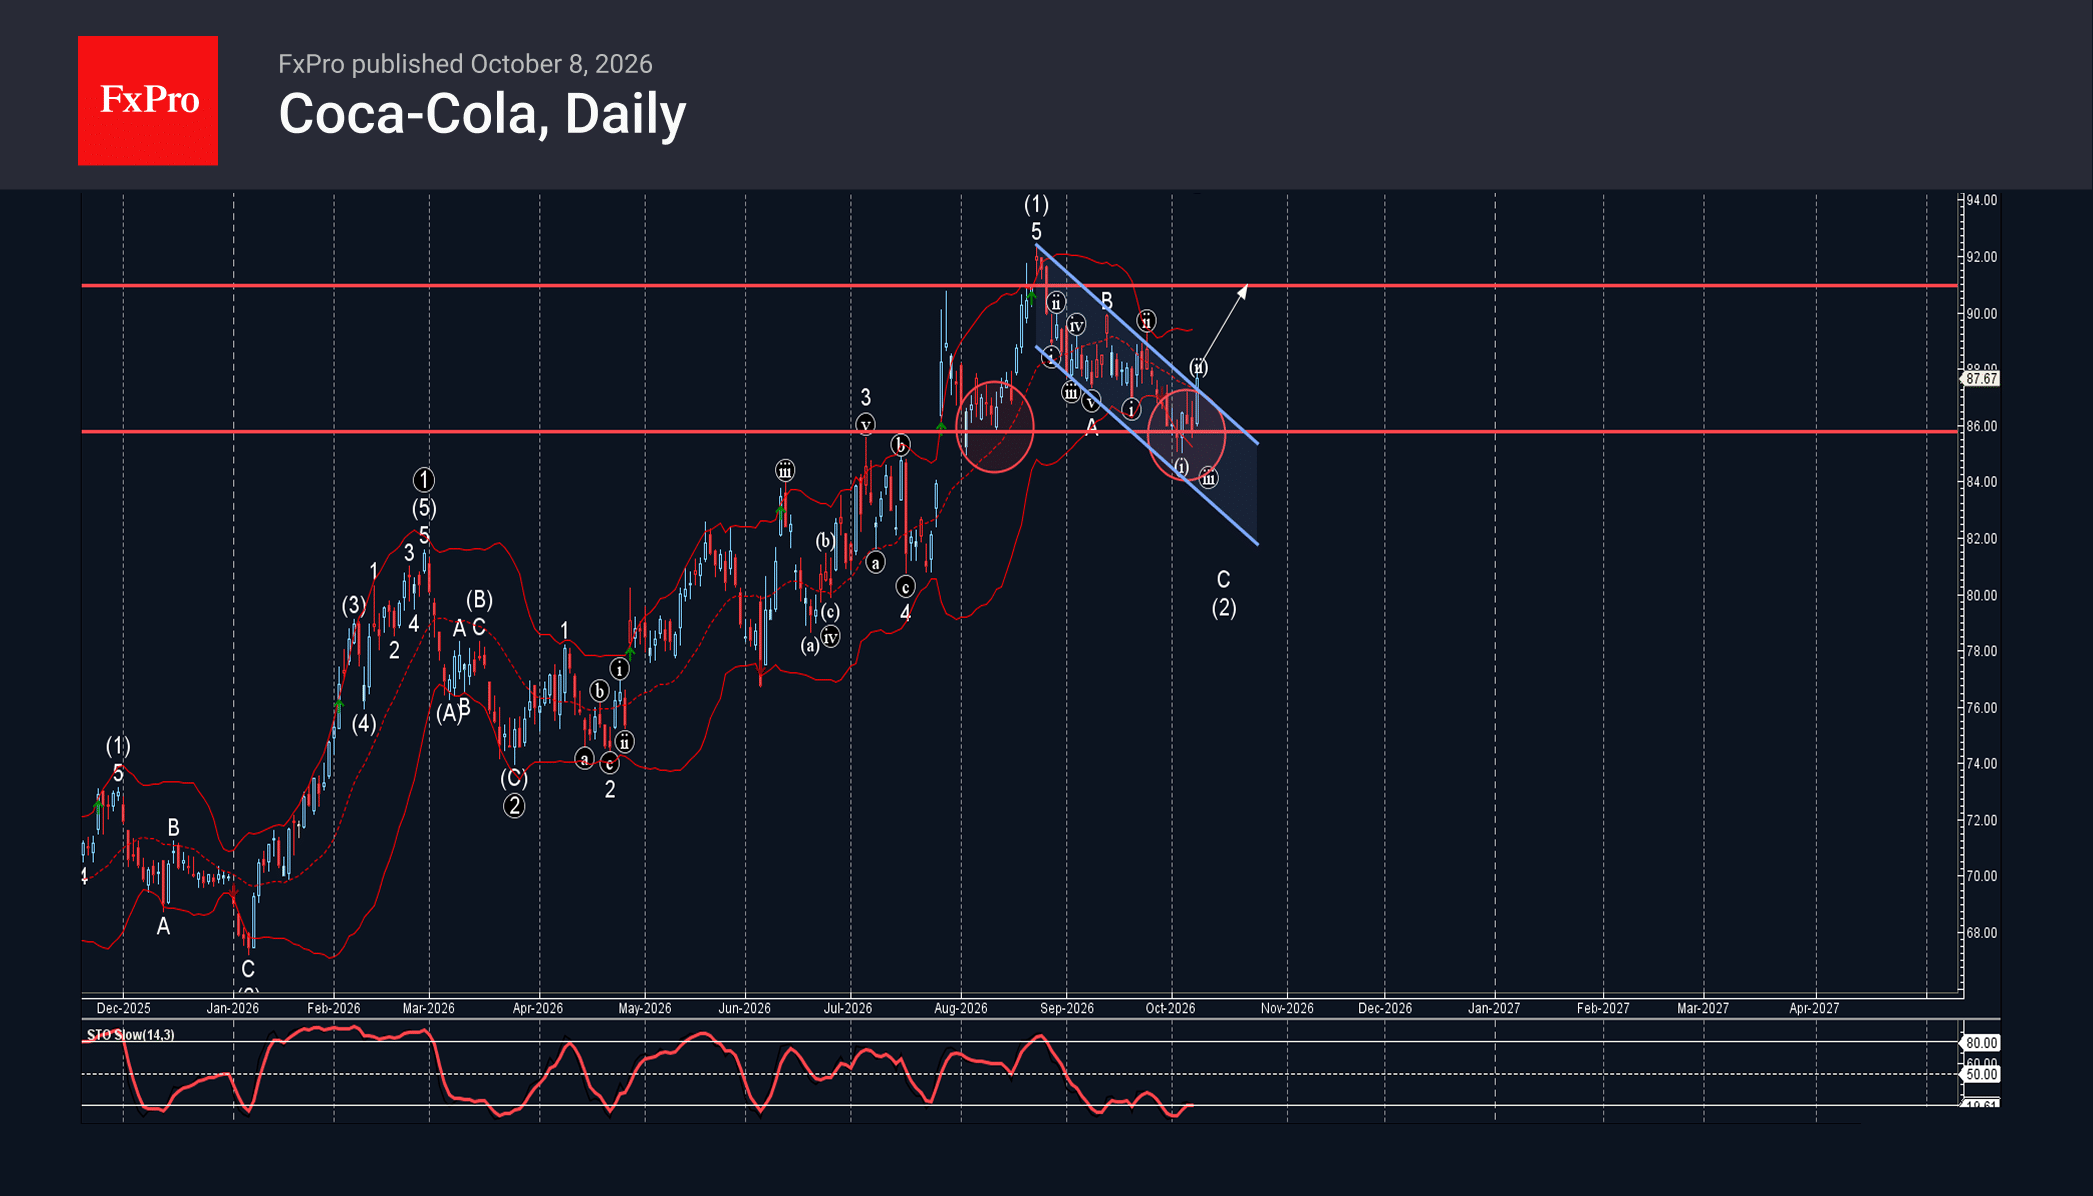
Coca-Cola: ⬆️ Buy – Coca-Cola broke daily down channel – Likely to rise to resistance level 91.00 Coca-Cola recently reversed up from the support zone between the key support level 86.00 (which has been reversing the price from August) and.