


Technical analysis - Page 140
December 2, 2024
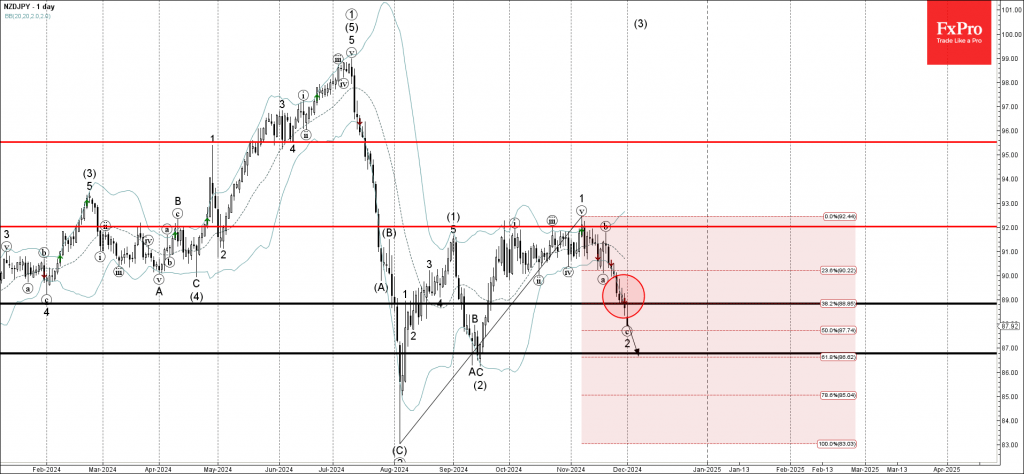
– NZDJPY broke support zone – Likely to fall to support level 86.75 NZDJPY currency pair recently broke the support zone located between the support level 89.00 and the 38.2% Fibonacci correction of the upward price move from the start.
November 29, 2024
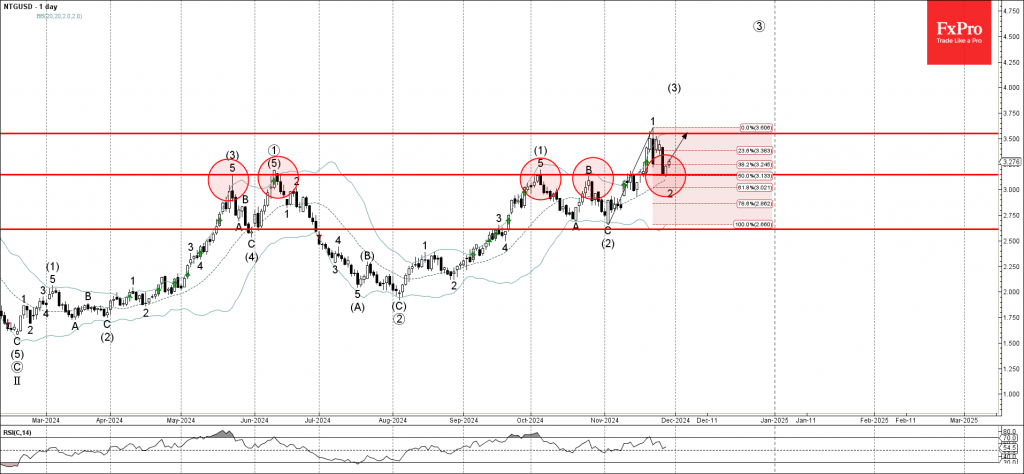
– Natural gas reversed from support zone – Likely to rise to resistance level 3.550 Natural gas recently reversed up from the support zone located between the support level 3.150 (former multi-month high from May, June and October), 20-day moving.
November 29, 2024
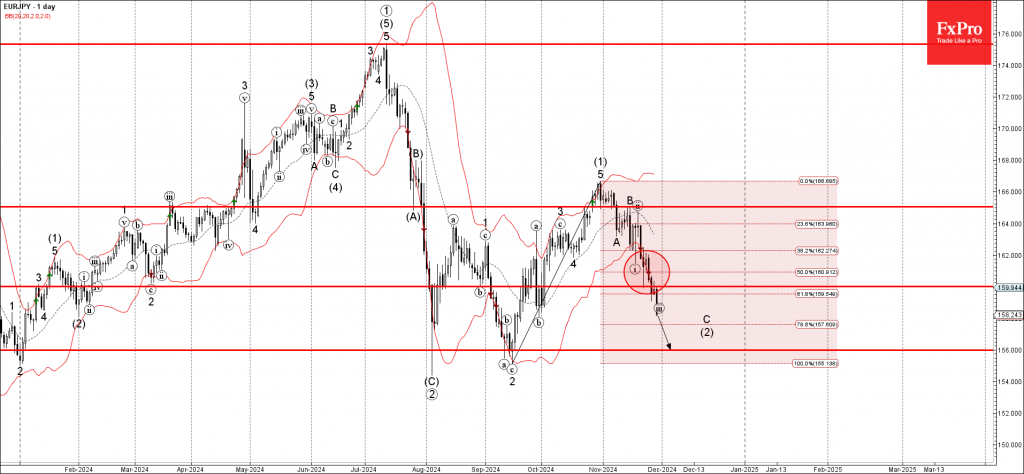
– EURJPY broke support zone – Likely to fall to support level 156.00 EURJPY currency pair recently broke the support zone located between the support level 160.00 and the 61.8% Fibonacci correction of the upward impulse from September. The breakout.
November 28, 2024
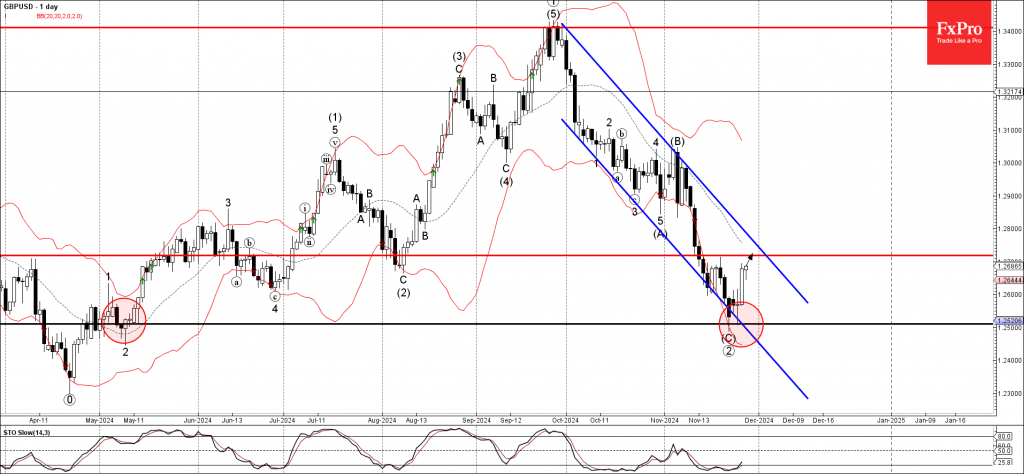
– GBPUSD reversed from support level 1.2500 – Likely to rise to resistance level 1.2720 GBPUSD currency pair continues to rise after the earlier upward reversal from the support level 1.2500 (which also reversed the pair in May) coinciding with.
November 28, 2024
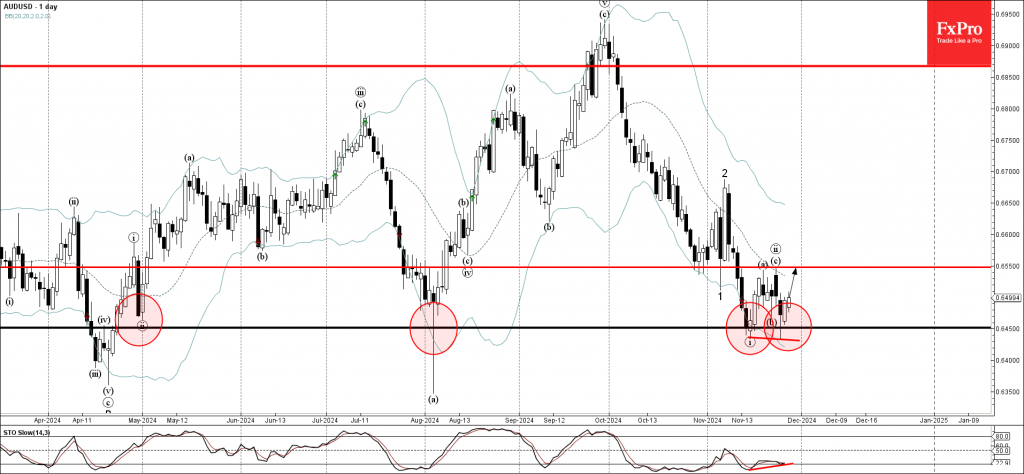
– AUDUSD reversed from pivotal support level 0.6450 – Likely to rise to resistance level 0.6550 AUDUSD currency pair recently reversed up from the pivotal support level 0.6450 (which has been reversing the price from April) standing near the lower.
November 27, 2024
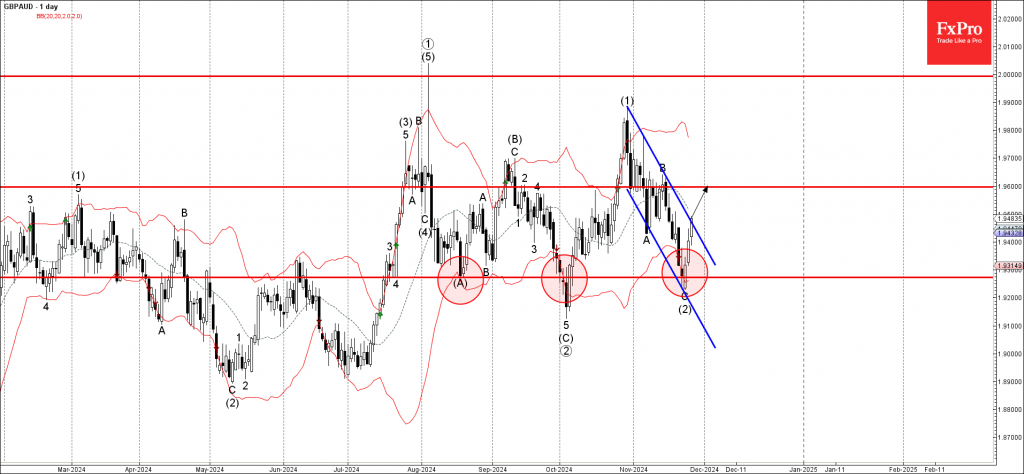
– GBPAUD broke daily down channel – Likely to rise to resistance level 1.9600 GBPAUD currency pair today broke the resistance trendline of the daily down channel from the end of October (which encloses the earlier downward ABC correction (2).
November 27, 2024
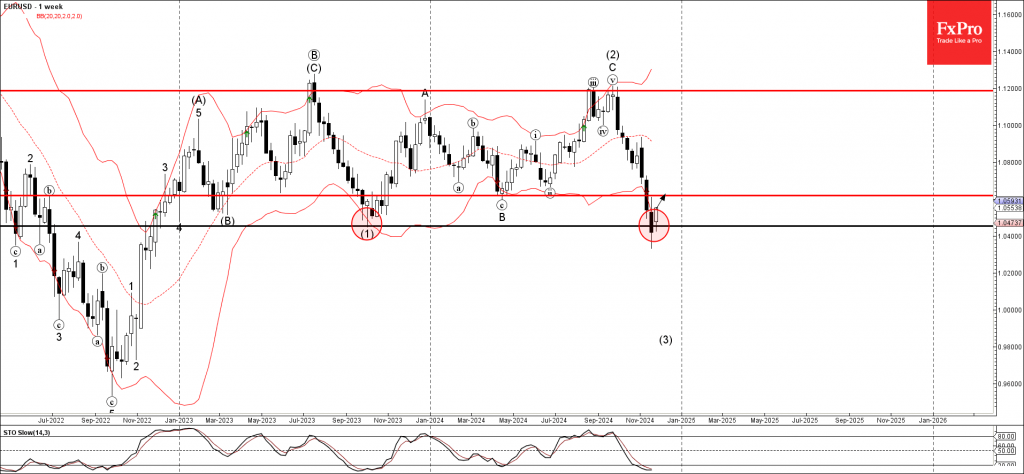
– EURUSD reversed from support area – Likely to rise to resistance level 1.0620 EURUSD currency pair recently reversed up from support area located at the intersection of the long-term support level 1.0455 (previous yearly low from 2023) and the.
November 26, 2024
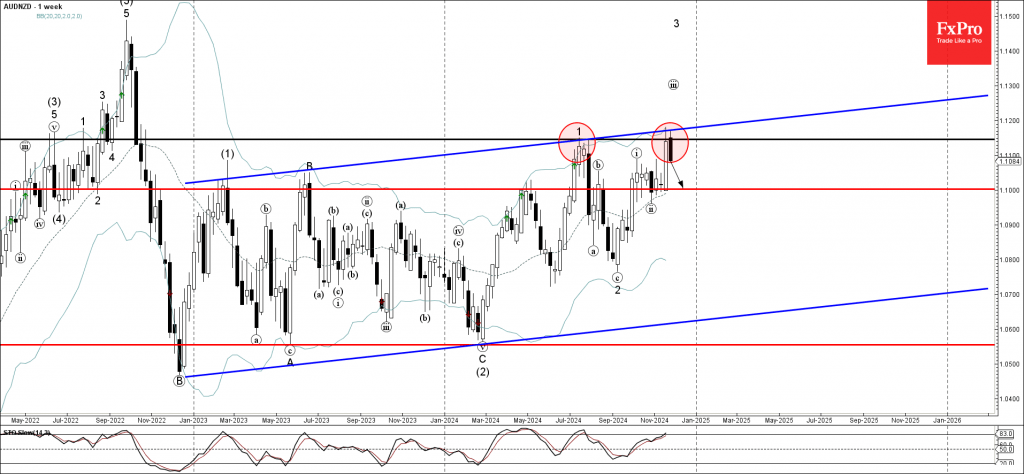
– AUDNZD reversed from resistance zone – Likely to fall to support level 1.1000 AUDNZD currency pair recently reversed down from resistance area located at the intersection of the resistance level 1.1145 (former top of the weekly impulse wave 1).
November 26, 2024
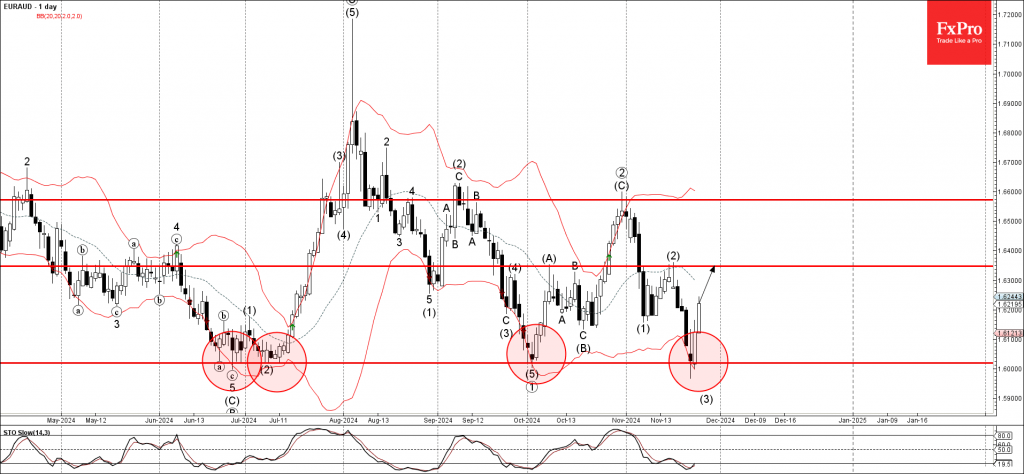
– EURAUD reversed from support zone – Likely to rise to resistance level 1.6350 EURAUD currency pair previously reversed from support area set between the pivotal support level 1.6020 (which has been reversing the pair from the end of June).
November 25, 2024
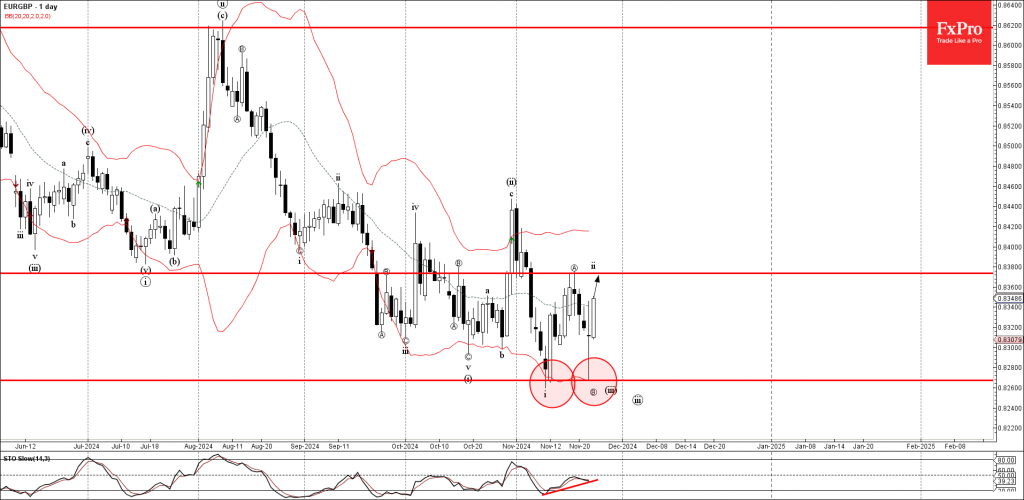
– EURGBP reversed from support zone – Likely to rise to resistance level 0.8375 EURGBP currency pair previously reversed up from the support area located at the intersection of the support level 0.8260 (which stopped the previous minor impulse wave.
November 25, 2024
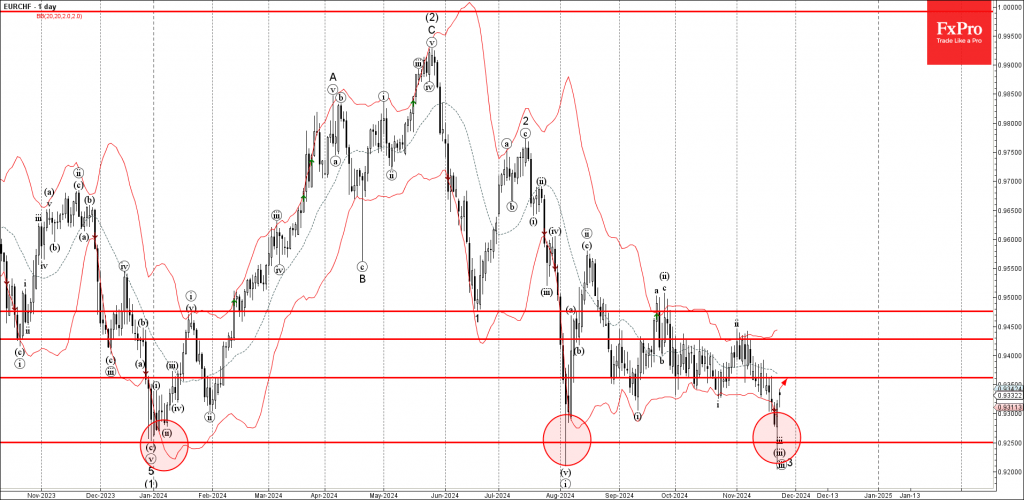
– EURCHF reversed from support zone – Likely to rise to resistance level 0.9360 EURCHF currency pair recently reversed up from the support zone located between the long-term support level 0.9250 (which has been reversing the price from the end.
November 22, 2024
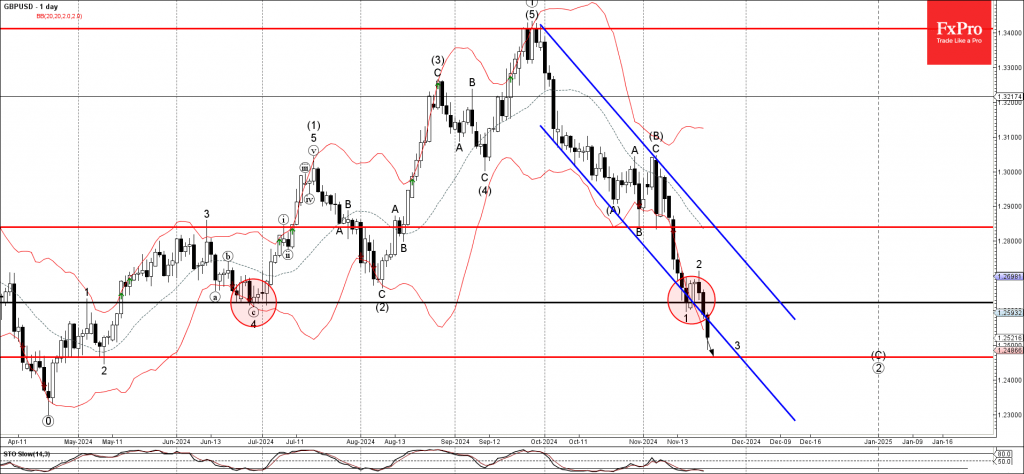
– GBPUSD broke support zone – Likely to fall to support level 1.2465 GBPUSD currency pair recently broke the support zone located between the support level 1.2620 (former monthly low from June) and the support trendline of the daily down.