


Technical analysis - Page 139
December 10, 2024
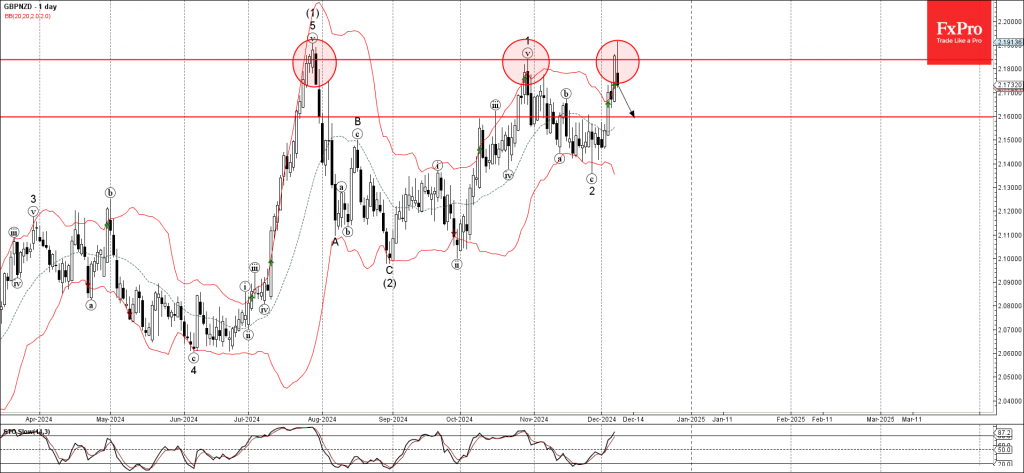
– GBPNZD reversed from key resistance level 2.1840 – Likely to fall to support level 2.1600 GBPNZD currency pair recently reversed down from the resistance zone between the key resistance level 2.1840 (which has been reversing the pair from July).
December 10, 2024
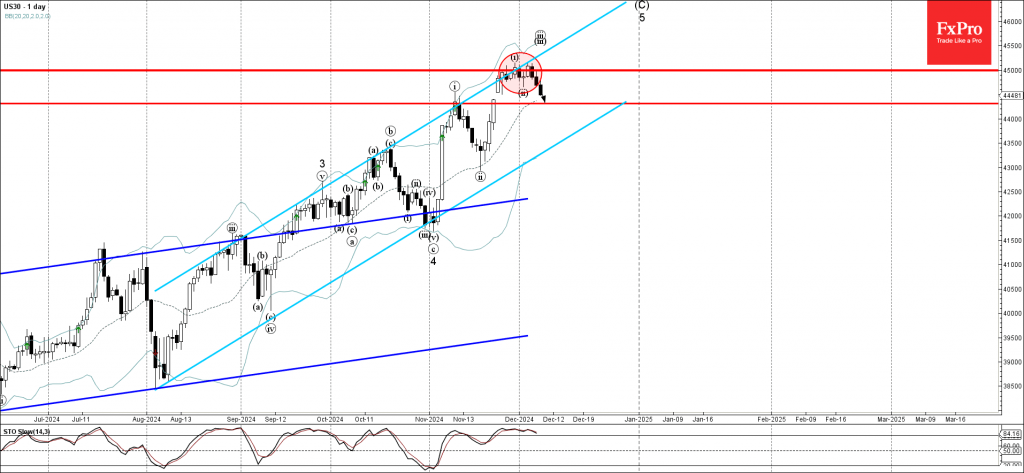
– Dow Jones reversed from resistance area – Likely to fall to support level 44300.00 Dow Jones index previously reversed down from the resistance area between the resistance level 45000.00 (which has been reversing the index from the end of.
December 6, 2024
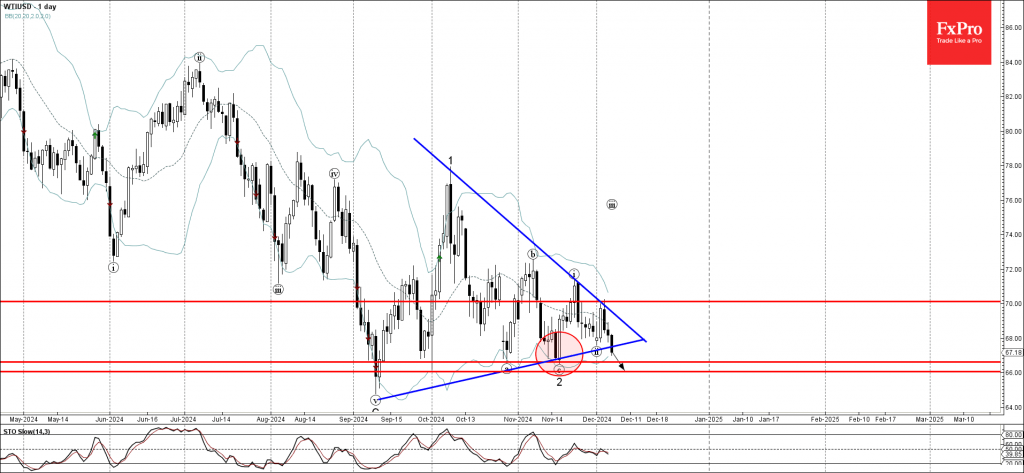
– WTI crude oil broke support zone – Likely to fall to support levels 66.6 and 66.00 WTI crude oil today broke the support zone lying at the intersection of the support level 67.60 and the support trendline of the.
December 6, 2024
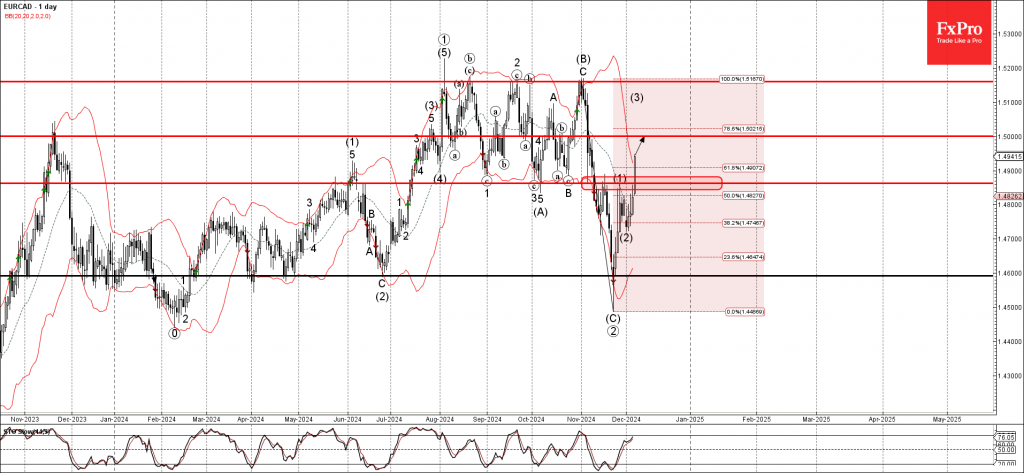
– EURCAD broke resistance zone – Likely to rise to resistance level 1.5000 EURCAD currency pair recently broke the resistance zone located between the resistance level 1.4865 (which has been reversing the pair from the middle of November) and the.
December 5, 2024
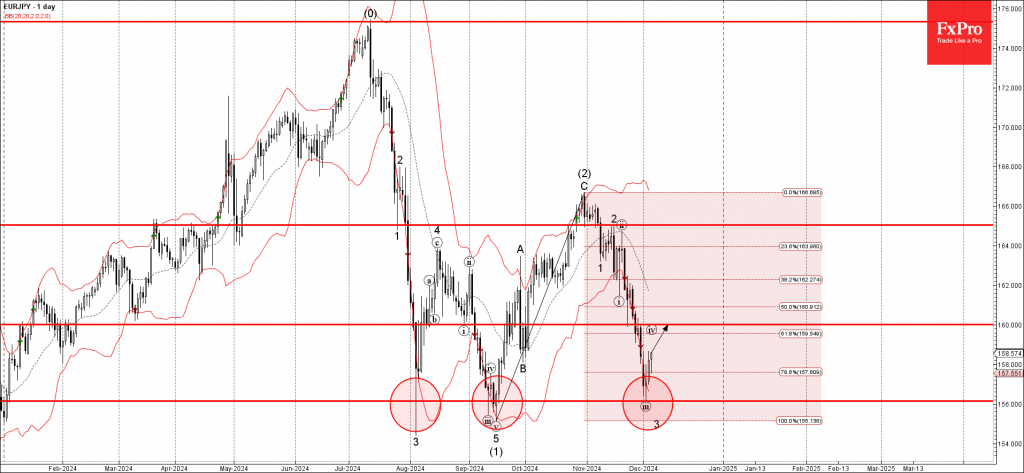
– EURJPY reversed from key support level 156.00 – Likely to rise to resistance level 160.00 EURJPY currency pair recently reversed up from the key support level 156.00 (which has been reversing the pair from the start of August) standing.
December 5, 2024
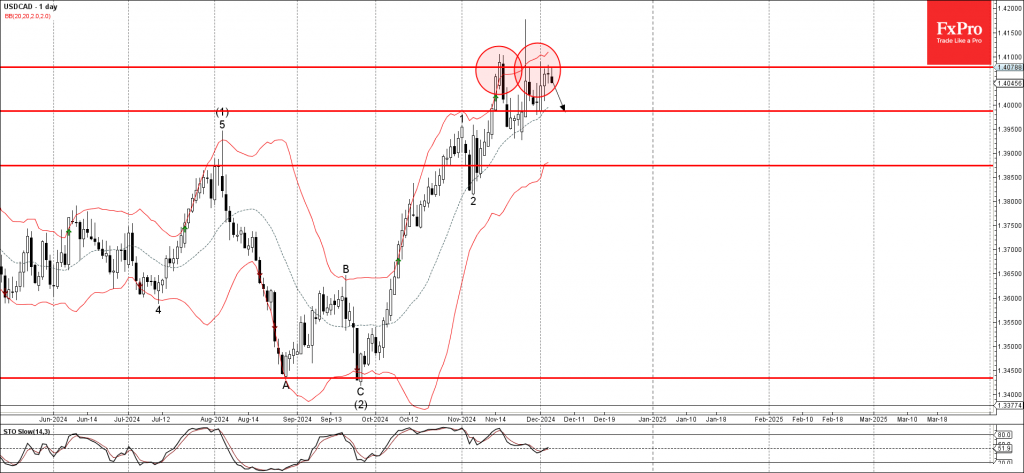
– USDCAD reversed from pivotal resistance level 1.4080 – Likely to fall to support level 1.3990 USDCAD currency pair today reversed down from the pivotal resistance level 1.4080 (which has been reversing the pair from the start of November) standing.
December 5, 2024
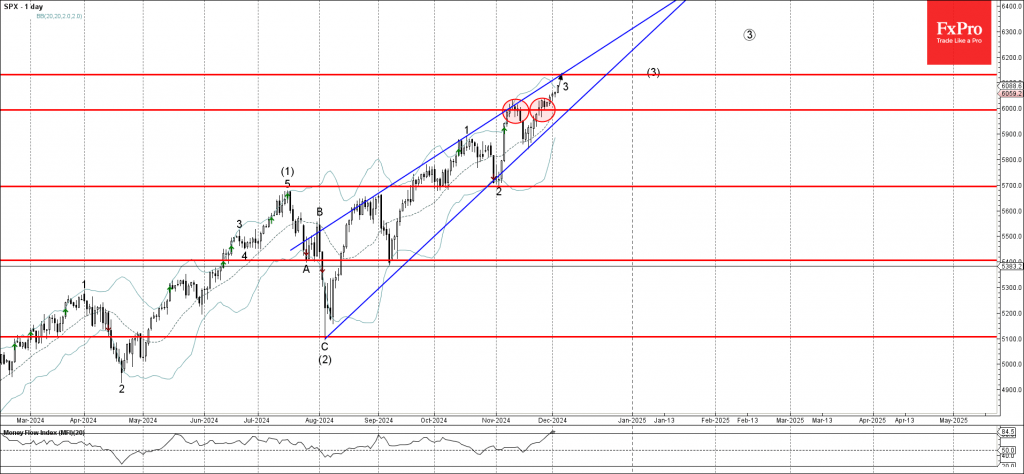
– S&P 500 broke round resistance level 6000.00 – Likely to rise to resistance level 6130.00 S&P 500 index continues to rise steadily after breaking the round resistance level 6000.00, which stopped the earlier upward impulse wave at the start.
December 5, 2024
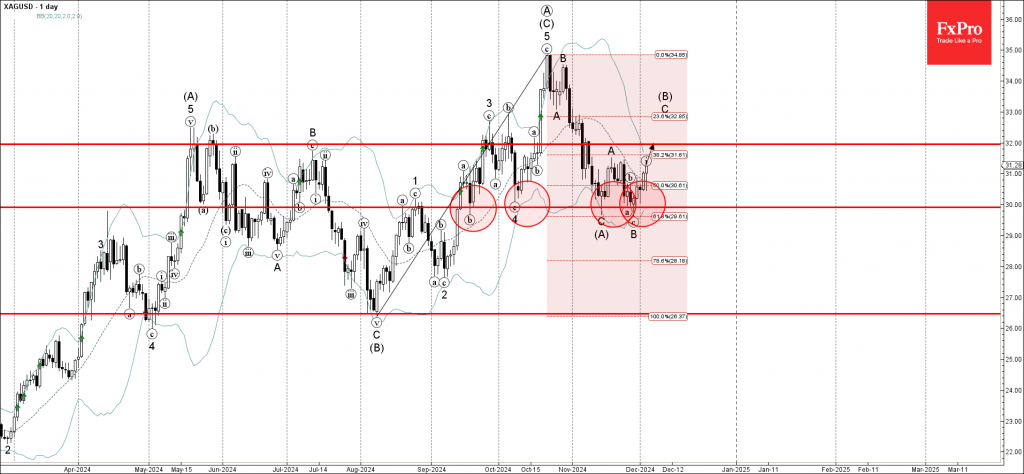
– Silver reversed from round support level 30.00 – Likely to rise to resistance level 32.00 Silver recently reversed up from the round support level 30.00, which has stopped all previous downward corrections from September. The support level 30.00 was.
December 3, 2024
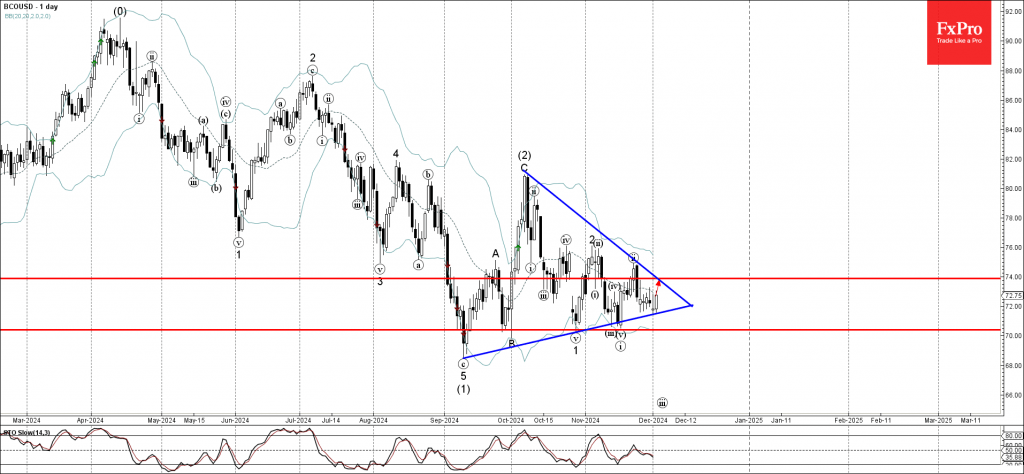
– Brent crude oil rising inside daily Triangle – Likely to rise to resistance level 74.00 Brent crude oil recently reversed up from the support trendline of the daily Triangle inside which the price has been moving since September. The.
December 3, 2024
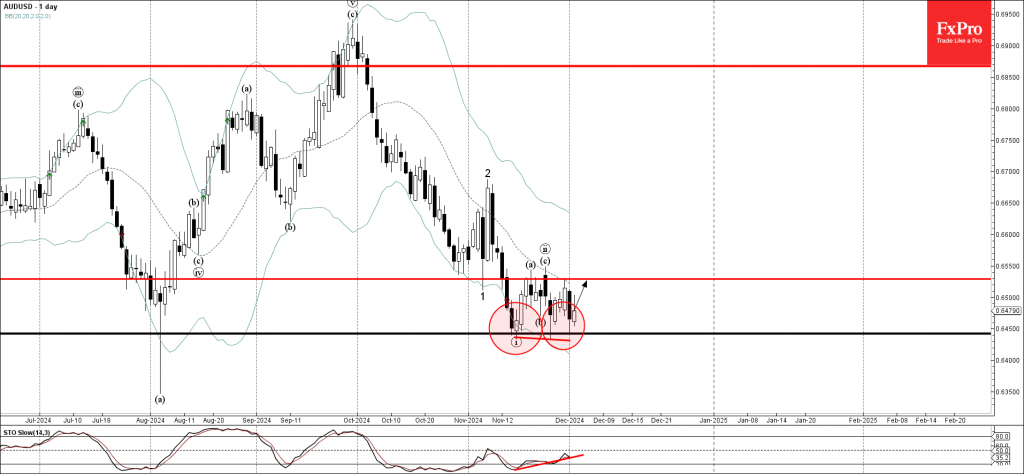
– AUDUSD reversed from strong support level 0.6450 – Likely to rise to resistance level 0.6530 AUDUSD currency pair recently reversed up from the strong support level 0.6450, which has been reversing the price from the start of August, as.
December 3, 2024
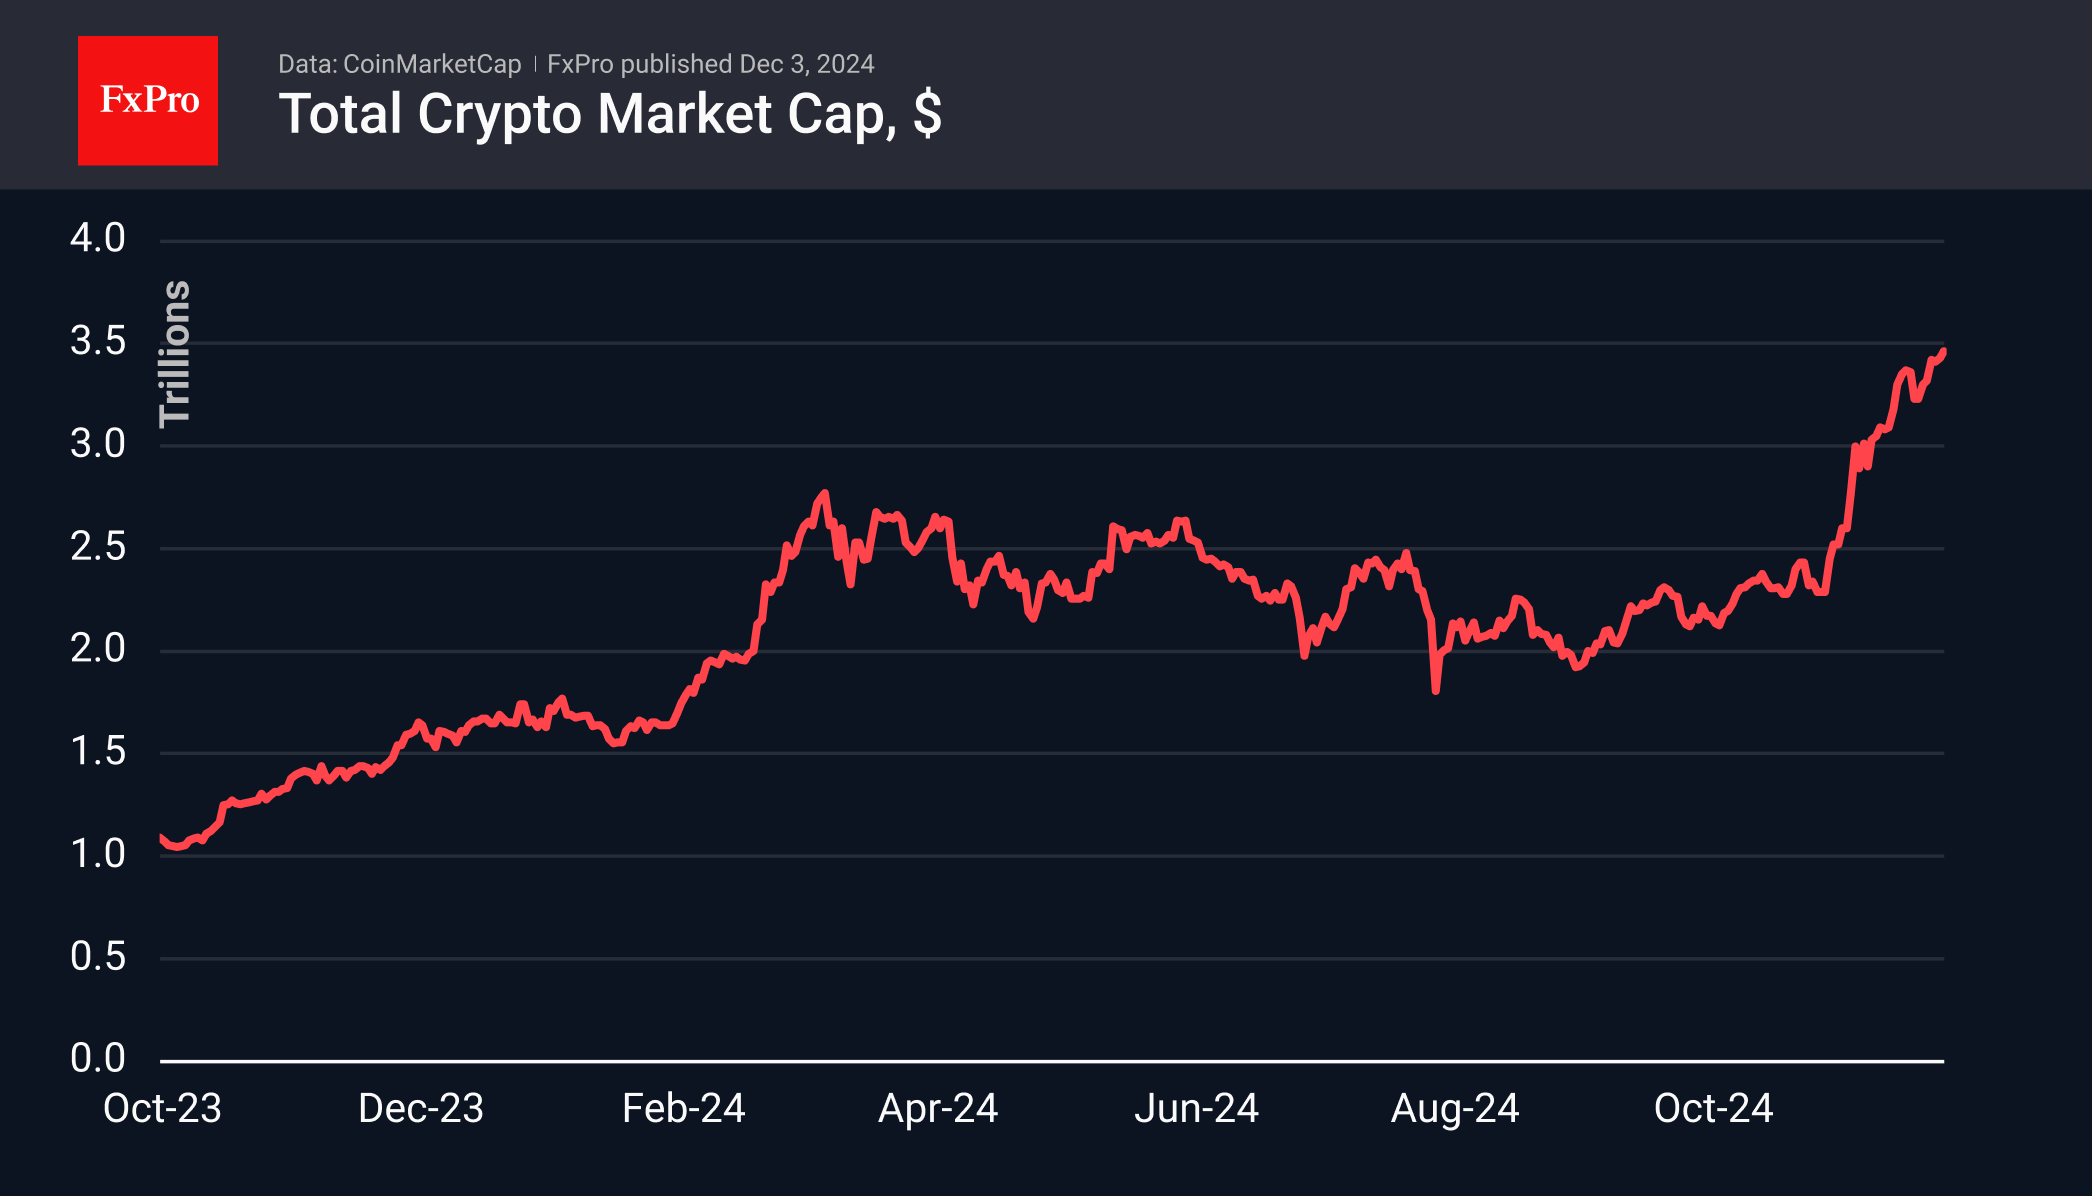
Bitcoin is unable to break $100K, but altcoins are thriving. XRP's price quadrupled, and global investment in crypto funds rose by $370 million. MicroStrategy bought more BTC.
December 2, 2024
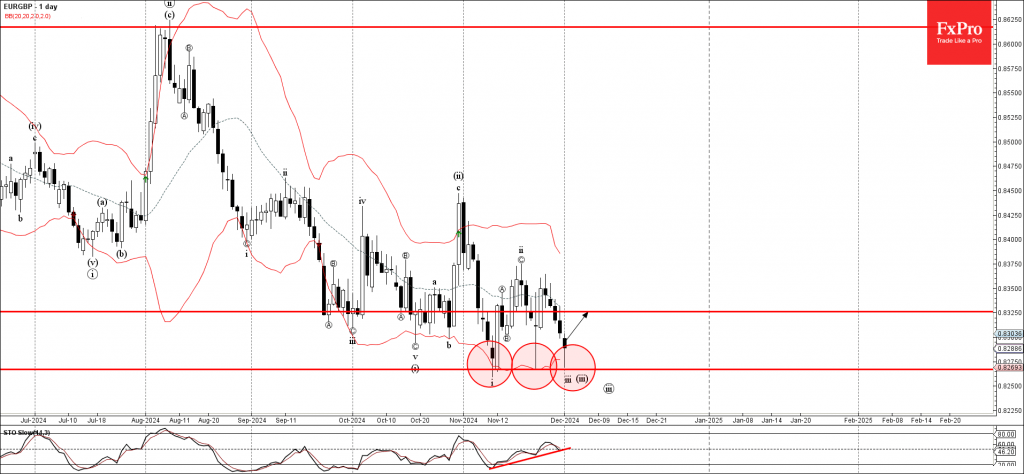
– EURGBP reversed from support zone – Likely to rise to resistance level 0.8325 EURGBP currency pair today reversed up from the support zone located between the strong support level 0.8265 (which has been revering the pair from the start.