


Technical analysis - Page 467

May 17, 2019
Sugar broke strong the support level 11.75 Further losses are likely Sugar under pressure after the earlier breakout of strong the support level 11.75 (which has been reversing the price from January). This breakout of the support level 11.75 should.

May 17, 2019
EURUSD reversed from resistance area Further losses are likely EURUSD recently reversed down from the resistance area lying between the resistance level 1.1260 (top of the previous Shooting Star from the start of May) and the upper daily Bollinger Band..

May 16, 2019
WTI rising inside ABC correction (2) Further gains are likely WTI continues to rise inside the medium-term ABC correction (2) which started recently from the support area surrounding the support level 60.00. This support area was further strengthened by the.
May 16, 2019
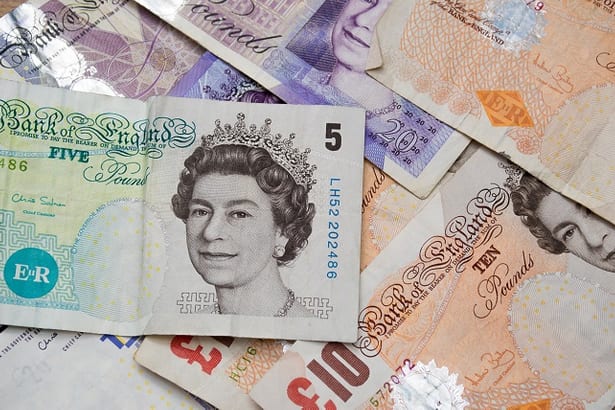
GBPUSD broke key support level 1.2900 Further losses are likely GBPUSD recently broke the key support level 1.2900 (which stopped the previous short-term impulse wave 1 at the end of April). The breakout of this support level continues the active.

May 15, 2019
For the best part of the last month Bitcoin has been relentlessly chomping into the altcoin markets as its dominance surged to a seventeen month high of 60 percent. An inevitable cooling off and pull back for Bitcoin is expected,.
May 15, 2019
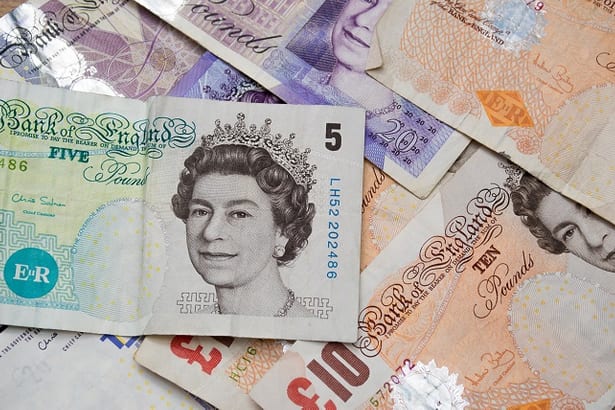
GBPCAD broke support area Further losses are likely GBPCAD recently broke the support area lying between the pivotal support level 1.7340 (which has been reversing the price in the last few weeks) and the 38.2% Fibonacci correction of the previous.

May 15, 2019
Soy reversed from support area Further gains are likely Soy recently reversed up from the support area lying between the long-term support level 814.00 (monthly low from July and September of last year), round support level 800.00 and the lower.

May 14, 2019
NZDCHF reversed from support area Further gains are likely NZDCHF recently reversed up from the support area lying between the support level 0.6600 (which stopped the previous downward correction in January), lower daily Bollinger Band and the 50% Fibonacci correction.

May 14, 2019
Corn reversed from support area Further gains are likely Corn recently reversed up from the support area lying between the support level 342.00 (which has been reversing the price from August) and the lower daily Bollinger Band. The upward reversal.

May 14, 2019
China has a so-called “nuclear option” in its escalating trade war with the United States — to sell off the U.S. Treasury bonds it currently holds and potentially trigger a massive rise in interest rates, causing plenty of damage to.

May 13, 2019
Soy broke support area Further losses are likely Soy recently broke the support area lying between the multi-month support level 814.00 (which has been reversing the price from the middle of 2018) and the round support level 800.00. The breakout.

May 13, 2019
AUDCHF broke support area Further losses are likely AUDCHF recently broke the support area lying between the support level 0.7030 (multi-month low from March) and the 38.2% Fibonacci correction of the previous upward impulse from January. The breakout of this.