


Technical analysis - Page 461

July 8, 2019
Corn reversed from support area Further gains are likely Corn recently reversed up from the support area lying between the key support level 412.00 (former resistance from May), lower daily Bollinger Band and the 38.2% Fibonacci correction level of the.

July 8, 2019
EURUSD reversed from resistance area Further losses are likely EURUSD recently reversed down from the resistance area lying between the strong resistance level 1.1400 (previous monthly high from February and March), upper weekly Bollinger Band and the 61.8% Fibonacci correction.

July 5, 2019
Platinum reversed from resistance area Further losses are likely Platinum recently reversed down with the daily Shooting Star from the resistance area lying between the resistance level 844.00 (former support from May), upper daily Bollinger Band and the 50% Fibonacci.

July 5, 2019
AUDUSD reversed from resistance area Further losses are likely AUDUSD recently reversed down from the resistance area lying between the resistance level 0.7020 (previous monthly high from June), upper daily Bollinger Band and the 50% Fibonacci correction level of the.

July 4, 2019
Silver reversed from support area Further gains are likely Silver recently reversed up from the support area lying between the support level 15.00 (former resistance from April and June – acting as support after was broken by the previous upward.
July 4, 2019
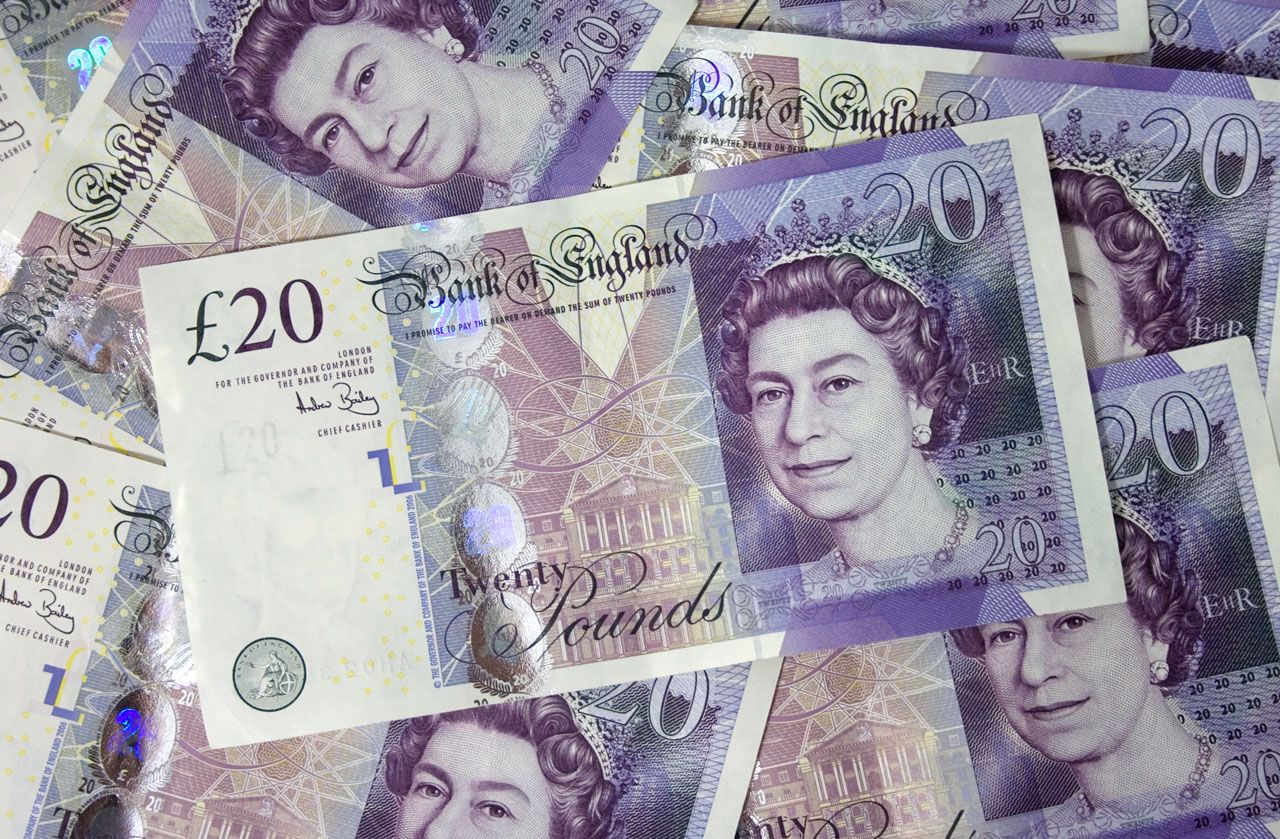
GBPAUD reversed from support area Further gains are likely GBPAUD recently reversed up from the support area lying between the support level 1.7870 (previous monthly low from February) and the lower daily Bollinger Band. The upward reversal from this support.

July 3, 2019
Gold reversed from resistance area Further losses are likely Gold today reversed down from the resistance area lying between the resistance level 1440.00 (which stopped the previous impulse wave (3)) and the upper daily Bollinger Band. If the price closes.

July 3, 2019
AUDCAD reversed from support area Further gains are likely AUDCAD recently reversed up from the support area lying between the key support level 0.9100 (which stopped the sharp downtrend in October of 2018) and the lower daily Bollinger Band. This.
July 2, 2019
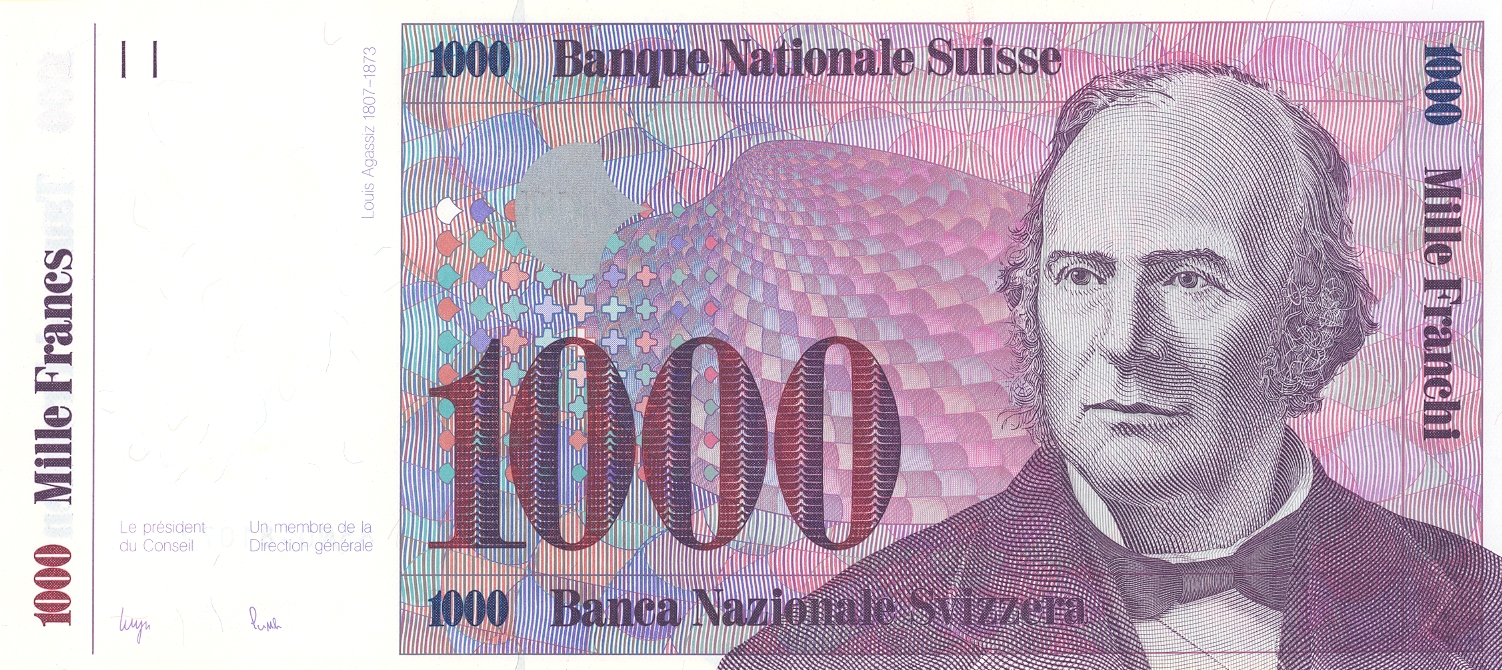
AUDCHF broke resistance area Further gains are likely AUDCHF recently broke the resistance area lying between the key resistance level 0.6890 (which reversed the price in the middle of June) and the 50% Fibonacci correction of the previous downward impulse.

July 2, 2019
Wheat reversed from resistance area Further losses are likely Wheat recently reversed down from the resistance area lying between the key resistance level 550.00 (which has been revering the price from August of 2018) and the upper daily Bollinger Band..

July 1, 2019
Natural Gas reversed from resistance area Further losses are likely Natural Gas recently reversed down from the resistance area lying between the resistance level 2.400 (top of the previous wave (iv) in June), upper daily Bollinger Band and the 50%.

July 1, 2019
AUDUSD reversed from resistance area Further losses are likely AUDUSD recently reversed down from the resistance area lying between the key resistance level 0.7020 (which also reversed the price in June) and the 50% Fibonacci correction of the previous downward.