


Technical analysis - Page 452
September 17, 2019
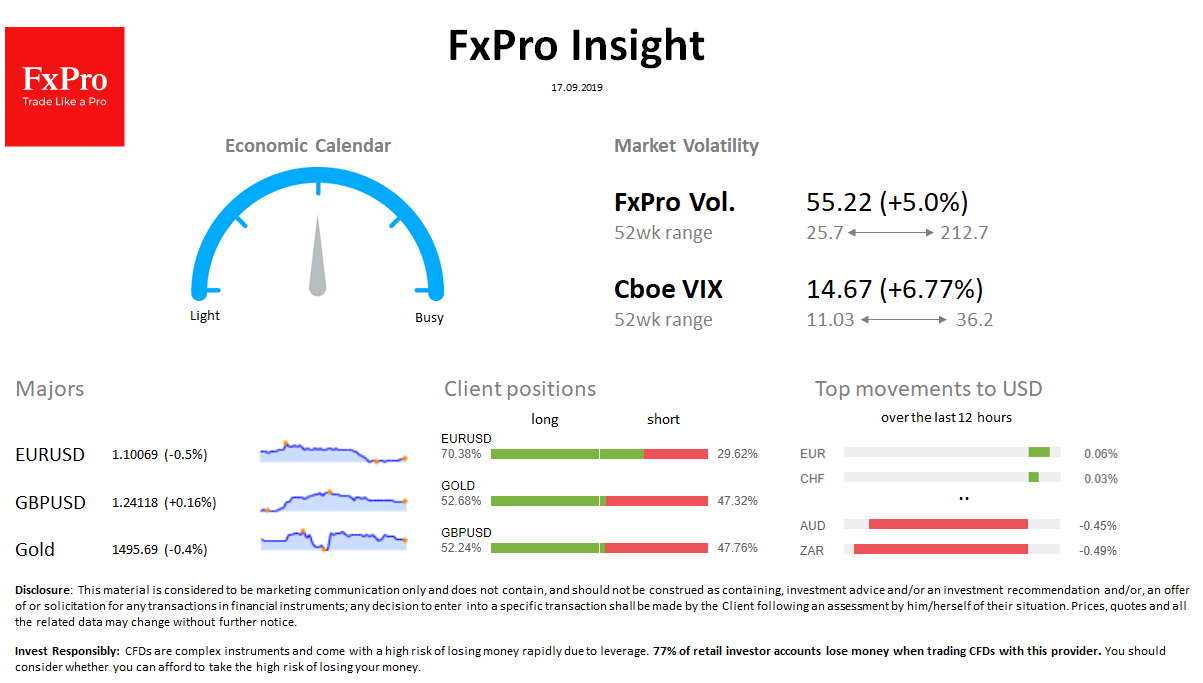
Market overview FX: On Monday the dollar index added 0.5% to 98.20. EURUSD dropped to 1.1000. EUR, CHF slightly increase this morning while most major currencies are losing ground to USD. The volatility of the foreign exchange market is within.

September 16, 2019
Silver reversed from support zone Further gains are likely Silver recently reversed up from the support zone lying between the support level 17.50 (former pivotal resistance from August), the support trendline from July and the 38.2% Fibonacci correction of the.
September 16, 2019
EURUSD reversed from resistance zone Further losses are likely EURUSD recently reversed down from the resistance zone lying between the resistance level 1.1080 (top of the previous wave (a)) and the resistance trendline of the daily down channel from June..
September 16, 2019
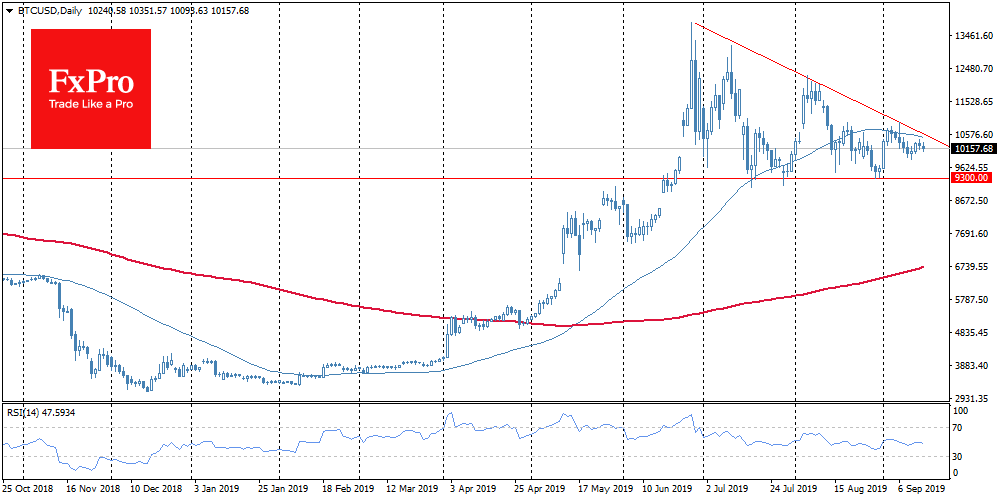
During the last day and throughout the weekend Bitcoin was in a limited price range, trading around $10,400. The trading volume has declined by about 20% since Friday. The situation with the difficulty of BTC production is quite different. Since.
September 16, 2019
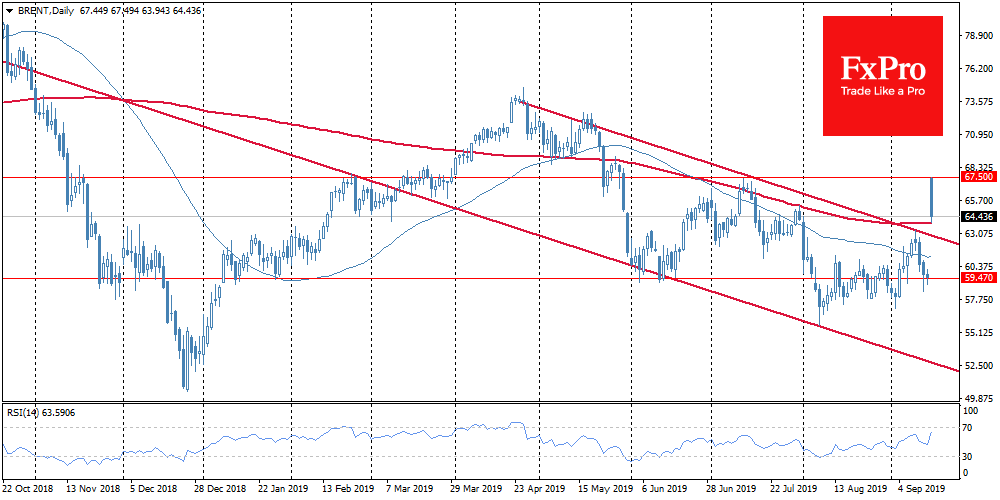
Brent opened the week with a price spike of more than 20% on reports of an attack on a significant oilfield in Saudi Arabia. Oil has made the sharpest intraday spike since the 1991 Gulf War. The oil price jump.
September 16, 2019
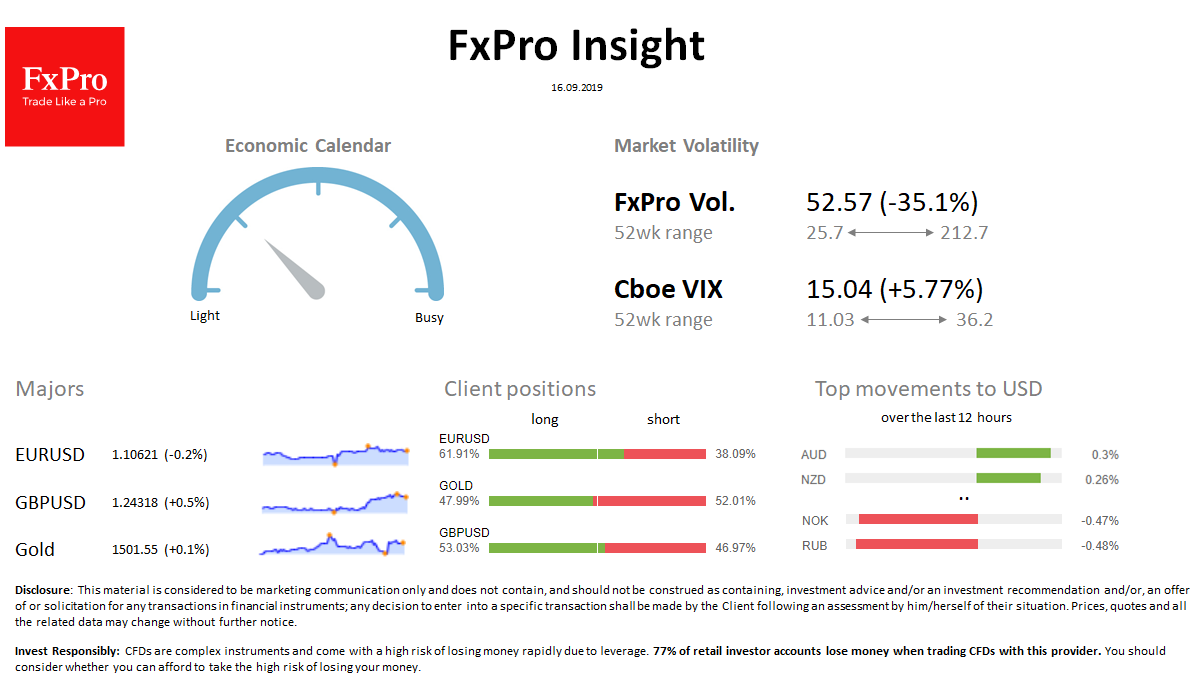
Market overview FX: The dollar index lost 0.2% to 98.0 at the start of the week’s trading, but has already returned positions. EURUSD is trading near Friday’s close at 1.1065. Crude oil-related CAD, NOK, RUB lost more than half of.

September 13, 2019
GBPNZD broke resistance zone Further gains are likely GBPNZD recently broke the resistance zone lying between the resistance level 1.9400 (which has been reversing the price from the middle of June) and the 61.8% Fibonacci correction of the previous downward.

September 13, 2019
Cotton reversed from support zone Further gains are likely Cotton recently reversed up from the support zone lying between the long-term support level 56.70 (which has been reversing the price from the start of 2015) and the lower weekly Bollinger.
September 13, 2019
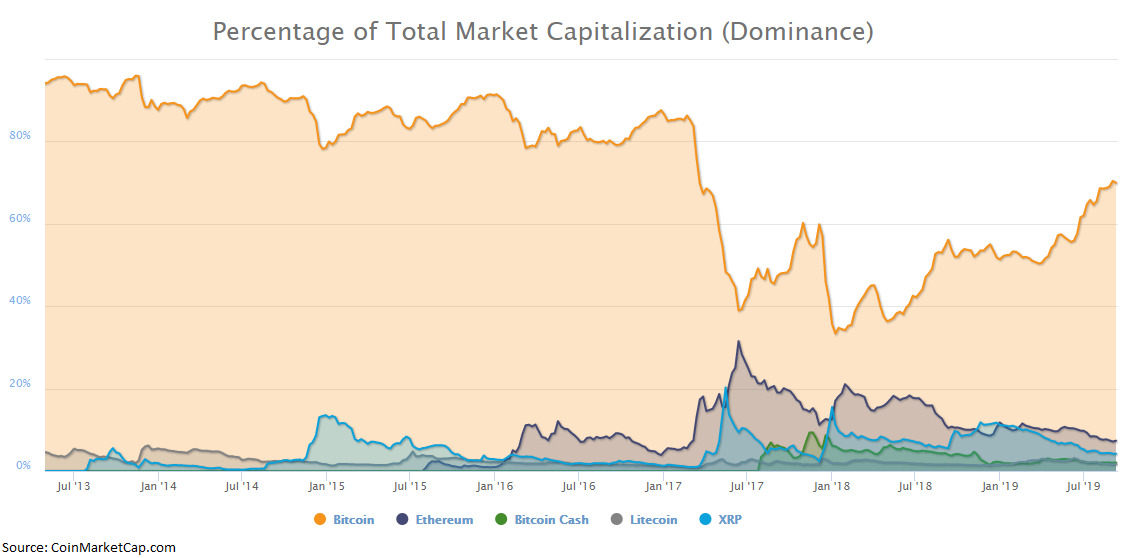
Crypto market remains in a sideways trend: Bitcoin traded around $10K on Friday morning, altcoins are still near the lows, BTC dominance index grew above 70%. Autumn promises to be productive on events with the deliverable futures launch from Bakkt,.
September 13, 2019
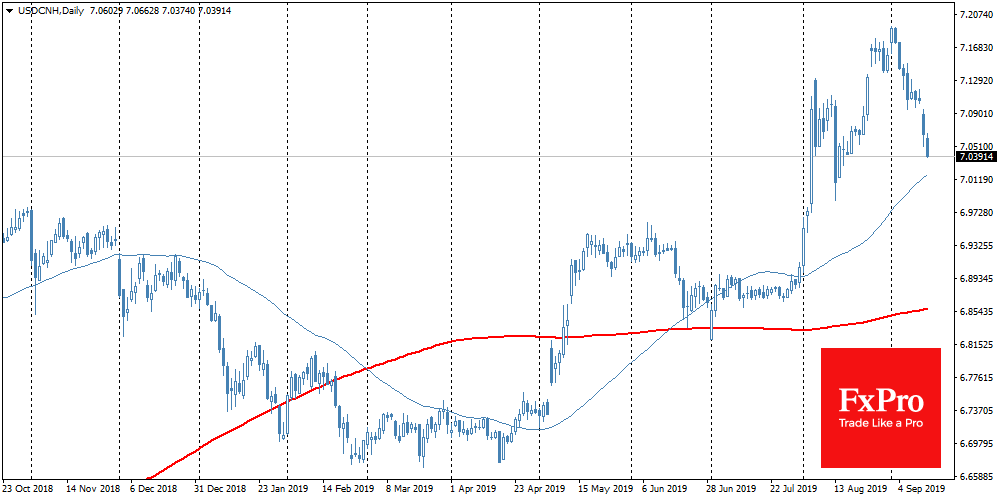
The market shows demand for yielding assets, which in turn supports demand for the stocks and currencies of emerging markets. The main reason for optimism is that China and the United States have moved their positions closer, in terms of.
September 12, 2019
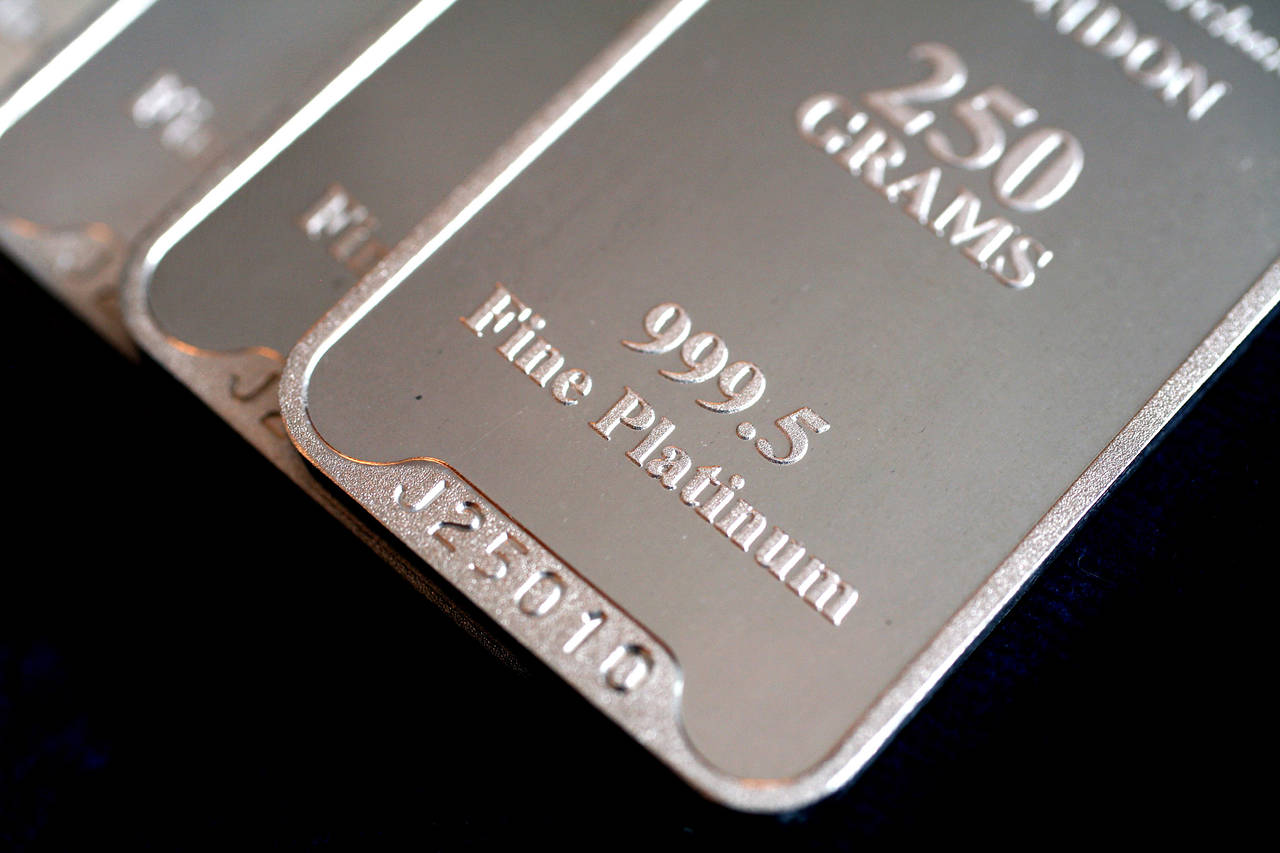
Platinum reversed from support zone Further gains are likely Platinum recently reversed up from the support zone lying between the key support level 931.00 (low of the previous wave (a)), upper trendline of the daily up channel from June and.

September 12, 2019
USDCHF reversed from resistance zone Further losses are likely USDCHF today reversed down from the resistance zone lying between the resistance level 0.9940 (which also reversed the price with the daily Evening Star at the start of August), upper daily.