


Technical analysis - Page 443
November 8, 2019
GBPNZD reversed from support zone Likely to rise to 2.0400. GBPNZD recently reversed up from the support zone lying between the round support level 2.000 (former monthly high from May and September) and the 50% Fibonacci correction of the.

November 8, 2019
Platinum broke support level 900.00 Likely to fall to 880.00 Platinum recently broke the support zone lying between the round support level 900.00 (former resistance from October) and the 50% Fibonacci correction of the previous upward impulse from October. The.

November 7, 2019
General Electric broke key resistance level 10.50 Likely to rise to 11.50 General Electric recently broke above the key resistance level 10,50 (which has reversed multiple upward impulses from the start of May). The breakout of the resistance level 10.50.
November 7, 2019
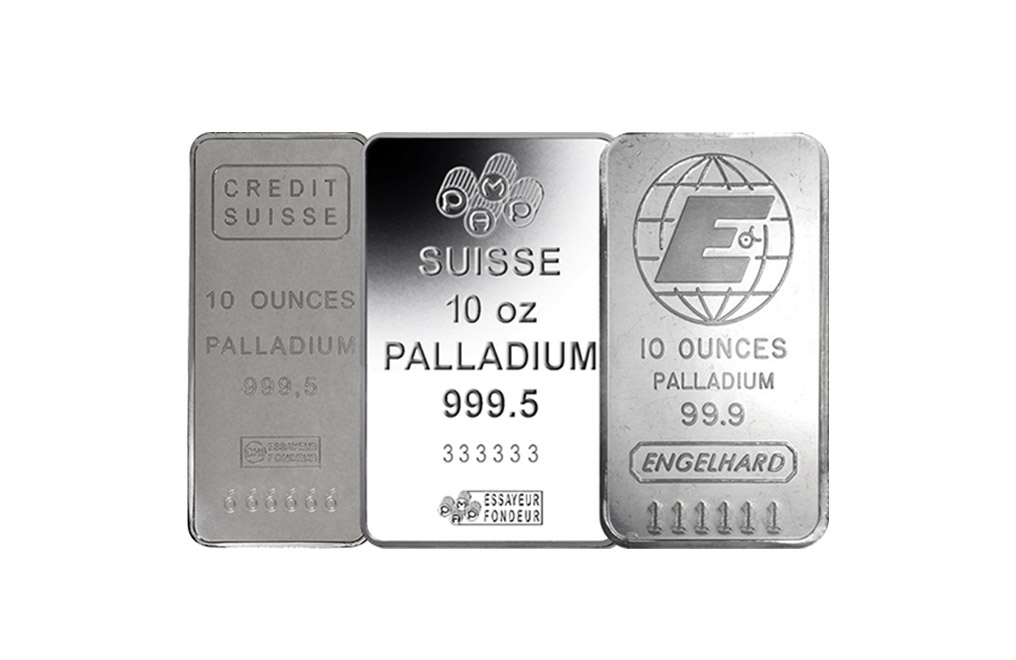
Palladium reversed from support zone Likely to rise to 1800.00 Palladium recently reversed up from support zone lying between the key support level 1750.00 (former resistance from October), lower daily Bollinger Band and the 38,2% Fibonacci correction of the previous.

November 7, 2019
GBPCAD reversed from resistance zone Likely to fall to 1.6700 GBPCAD recently reversed down from resistance zone lying between the strong resistance level 1.7040 (top of the previous impulse wave 1), upper daily Bollinger Band and the 61.8% Fibonacci correction.

November 6, 2019
Goldman Sachs reversed from resistance zone Likely to fall to 212.00 Goldman Sachs recently reversed down from the resistance area lying between the multi-month resistance level 220.00 (which has been reversing the price from July) and the upper daily Bollinger.

November 6, 2019
Copper reversed from resistance zone Likely to fall to 262.00 Copper under bearish pressure after the earlier downward reversal from the resistance area lying between the key resistance level 270.40 (top of the daily Evening Star from September), upper daily.

November 6, 2019
USDJPY reversed from resistance zone Likely to fall to 108.50 USDJPY recently reversed down from resistance zone lying between the strong resistance level 109.2 (which has been reversing the price from the start of August), upper daily Bollinger Band and.

November 5, 2019
Boeing reversed from powerful support level 320.00 Likely to rise to 360.00 Boeing recently reversed up sharply from the powerful support level 320.00 (former multi-month low from the middle of August). The upward reversal from the support level 320.00 started.

November 5, 2019
Brent Crude Oil broke key resistance level 61.90 Likely to rise to 64.00 Brent Crude Oil recently broke above the key resistance level 61.90 (top of the previous impulse wave (i) from the end of October). The breakout of the.

November 5, 2019
EURCAD reversed from resistance zone Likely to fall to 1.4450 EURCAD recently reversed down from resistance zone lying between the strong resistance level 1.4690 (which has been reversing the price from September), upper daily Bollinger Band and the 50% Fibonacci.
November 4, 2019
Bank of America reversed from key support level 31.00 Likely to rise to 32.20 Bank of America recently reversed up sharply from the key support level 31.00 (former key resistance and the upper boundary of the wide sideways price range.