


Technical analysis - Page 431
January 17, 2020
Natural Gas broke multi-month support level 2.078 Likely to fall to 2.000 Natural Gas recently broke the strong, multi-month support level 2.078 (low of the previous impulse wave (i), which has been reversing the price from last August). The breakout.

January 17, 2020
Cisco Systems broke resistance area Likely to rise to 50.00 Cisco Systems recently rose sharply through the resistance area lying between the resistance levels 48.20 (top of the previous wave A from December) and 48.75 (monthly high from November). The.

January 17, 2020
NZDJPY reversed from resistance area Likely to fall to 370.00 NZDJPY recently reversed down from the resistance area lying between the key, long-term resistance level 73.30 (which has been reversing the price from July) and the upper daily Bollinger Band..

January 16, 2020
Johnson & Johnson broke key resistance level 146.90 Likely to rise to 148.70 Johnson & Johnson continues to rise after the earlier breakout of the key resistance level 146.90 (monthly high from December). The breakout of the resistance level 146.90.

January 16, 2020
EURNZD reversed from resistance area Likely to fall to 1.6640 EURNZD recently reversed down with the daily Hammer from the resistance area lying between the pivotal resistance level 1.6850 (former strong support from December), upper daily Bollinger Band and.

January 16, 2020
Corn reversed from resistance area Likely to fall to 370.00 Corn recently reversed down from the resistance area lying between the multi-month resistance level 390.00 (which has been reversing the price from October), upper daily Bollinger Band and the 38.2%.
January 16, 2020
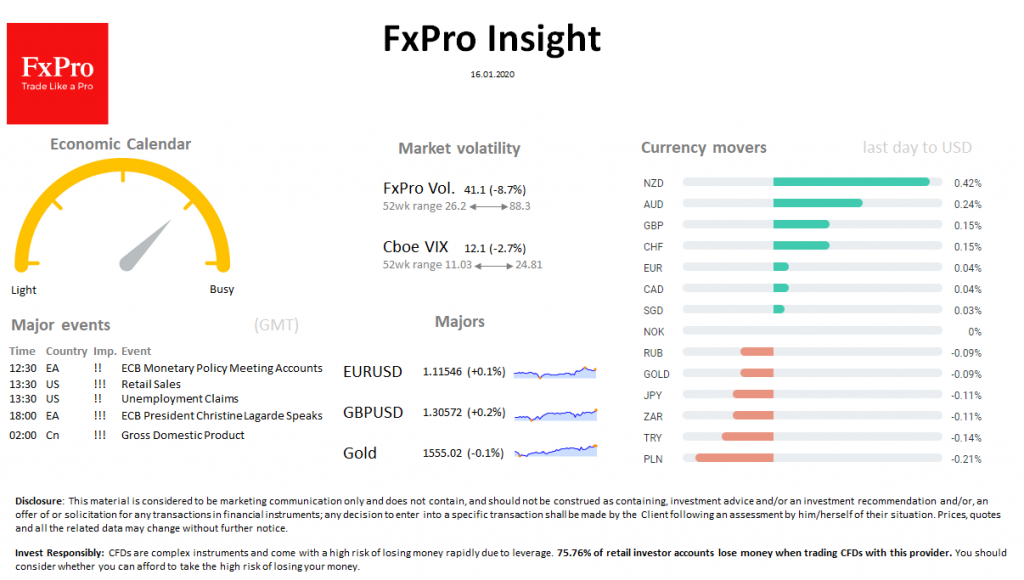
The global market continues to grow, while Australia, India and US stock indices update record highs. Dow Jones closed above 29,000, and the S&P 500 hit 3300. NZD and AUD are leading the growth to USD on higher demand for.

January 14, 2020
Alibaba rising inside sharp impulse wave C Likely to rise to 240.00 Alibaba continues to rise inside the sharp impulse wave C, which recently broke above the resistance level 220.00 (which reversed the price at the start of January) and.
January 14, 2020
Natural Gas rising inside impulse waves 3 and (3) Likely to rise to 2.300 Natural Gas continues to rise inside the impulse wave 3, which started recently from the support area lying between the support level 2.078 (which stopped the.

January 14, 2020
EURGBP reversed from resistance area Likely to fall to 0.8465 EURGBP recently reversed down from the resistance area lying between the resistance level 0.8600 (which has been reversing the price from November), upper daily Bollinger Band and the 38.2% Fibonacci.

January 13, 2020
Boeing reversed from resistance area Likely to fall to 321.00 Boeing recently reversed down with the daily Shooting Star from the resistance area lying between the resistance level 340.00 (top of the previous wave A from December), upper daily Bollinger.

January 13, 2020
Wheat reversed from resistance area Likely to fall to 545.00 Wheat recently reversed down from the resistance area lying between the resistance level 566.50 (top of the previous Shooting Star from December) and the upper daily Bollinger Band. The downward.