


Technical analysis - Page 394

June 16, 2020
• EURGBP reversed from resistance area• Likely to fall 0.8865 EURGBP recently reversed down from the resistance area lying between the round resistance level 0.9000 (which stopped the previous waves 3, (1) and B), upper daily Bollinger band and the.

June 16, 2020
• EURAUD reversed from resistance area• Likely to fall 1.6084 EURAUD recently reversed down from the resistance zone lying between the key resistance level 1.6500( former strong support from the end of May) and the 50% Fibonacci retracement of the.
June 16, 2020
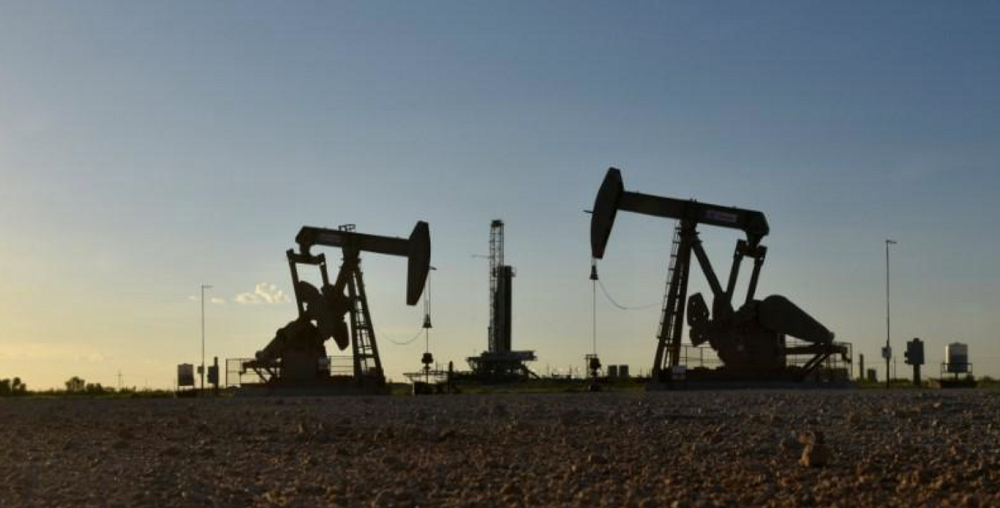
• WTI reversed from key support level 35.00• Likely to rise 40.00 WTI recently reversed up from the key support level 35.00 (former top of the pervious short-term correction (a) from the end of May). The upward reversal from the.

June 16, 2020
• Chevron reversed from multi-month support level 88.75• Likely to rise 103.00 Chevron recently reversed up from the strong, multi-month support level 88.75 (former resistance from April, which has been reversing the price from May). The support area near the.

June 15, 2020
• Copper reversed from resistance zone • Likely to fall to 250.00 Copper recently reversed down from the resistance area lying between the pivotal resistance level 262.00 (former monthly high from February and March), upper daily Bollinger Band and the.

June 15, 2020
• USDCHF reversed from resistance zone • Likely to fall to 0.9400 USDCHF recently reversed down from the resistance area lying between the resistance level 0.9500 (former support from the end of March) and the 38.2% Fibonacci correction of the.

June 15, 2020
• CHFJPY reversed from support zone • Likely to rise to 113.70 CHFJPY recently reversed up from the support area lying between the key support level 112.5 (former monthly high from April) and the 38.2% Fibonacci correction of the previous.

June 15, 2020
• BMY falling inside sharp impulse wave C • Likely to reach 53.40 Bristol-Myers Squibb continues to fall inside the sharp impulse wave C, which previously broke through the support area lying between the support level 59.15 (low of wave.

June 12, 2020
• GBPCAD reversed from resistance zone • Likely to fall to 1.6890 GBPCAD today reversed down from the resistance area located between the pivotal resistance level 1.7200 (former support from April and May), upper daily Bollinger Band and the 38.2%.
June 12, 2020
• CADJPY reversed from support zone • Likely to rise to 80,00 CADJPY today reversed up sharply from the support zone located between the key support level 78.33 (which reversed the price in March and April) and the 50% Fibonacci.

June 12, 2020
• EURCAD reversed from resistance zone • Likely to fall to 1,5200 EURCAD today reversed down from the resistance zone located between the key resistance level 1,5385 (which reversed the price in May and at the start of June), upper.

June 12, 2020
• NZDCAD reversed from resistance zone • Likely to fall to 0.8700 NZDCAD recently reversed down from the resistance zone located between the key resistance level 0,8800 (which stopped the sharp impulse wave (C) in December) and the upper daily.