


Technical analysis - Page 385
July 17, 2020
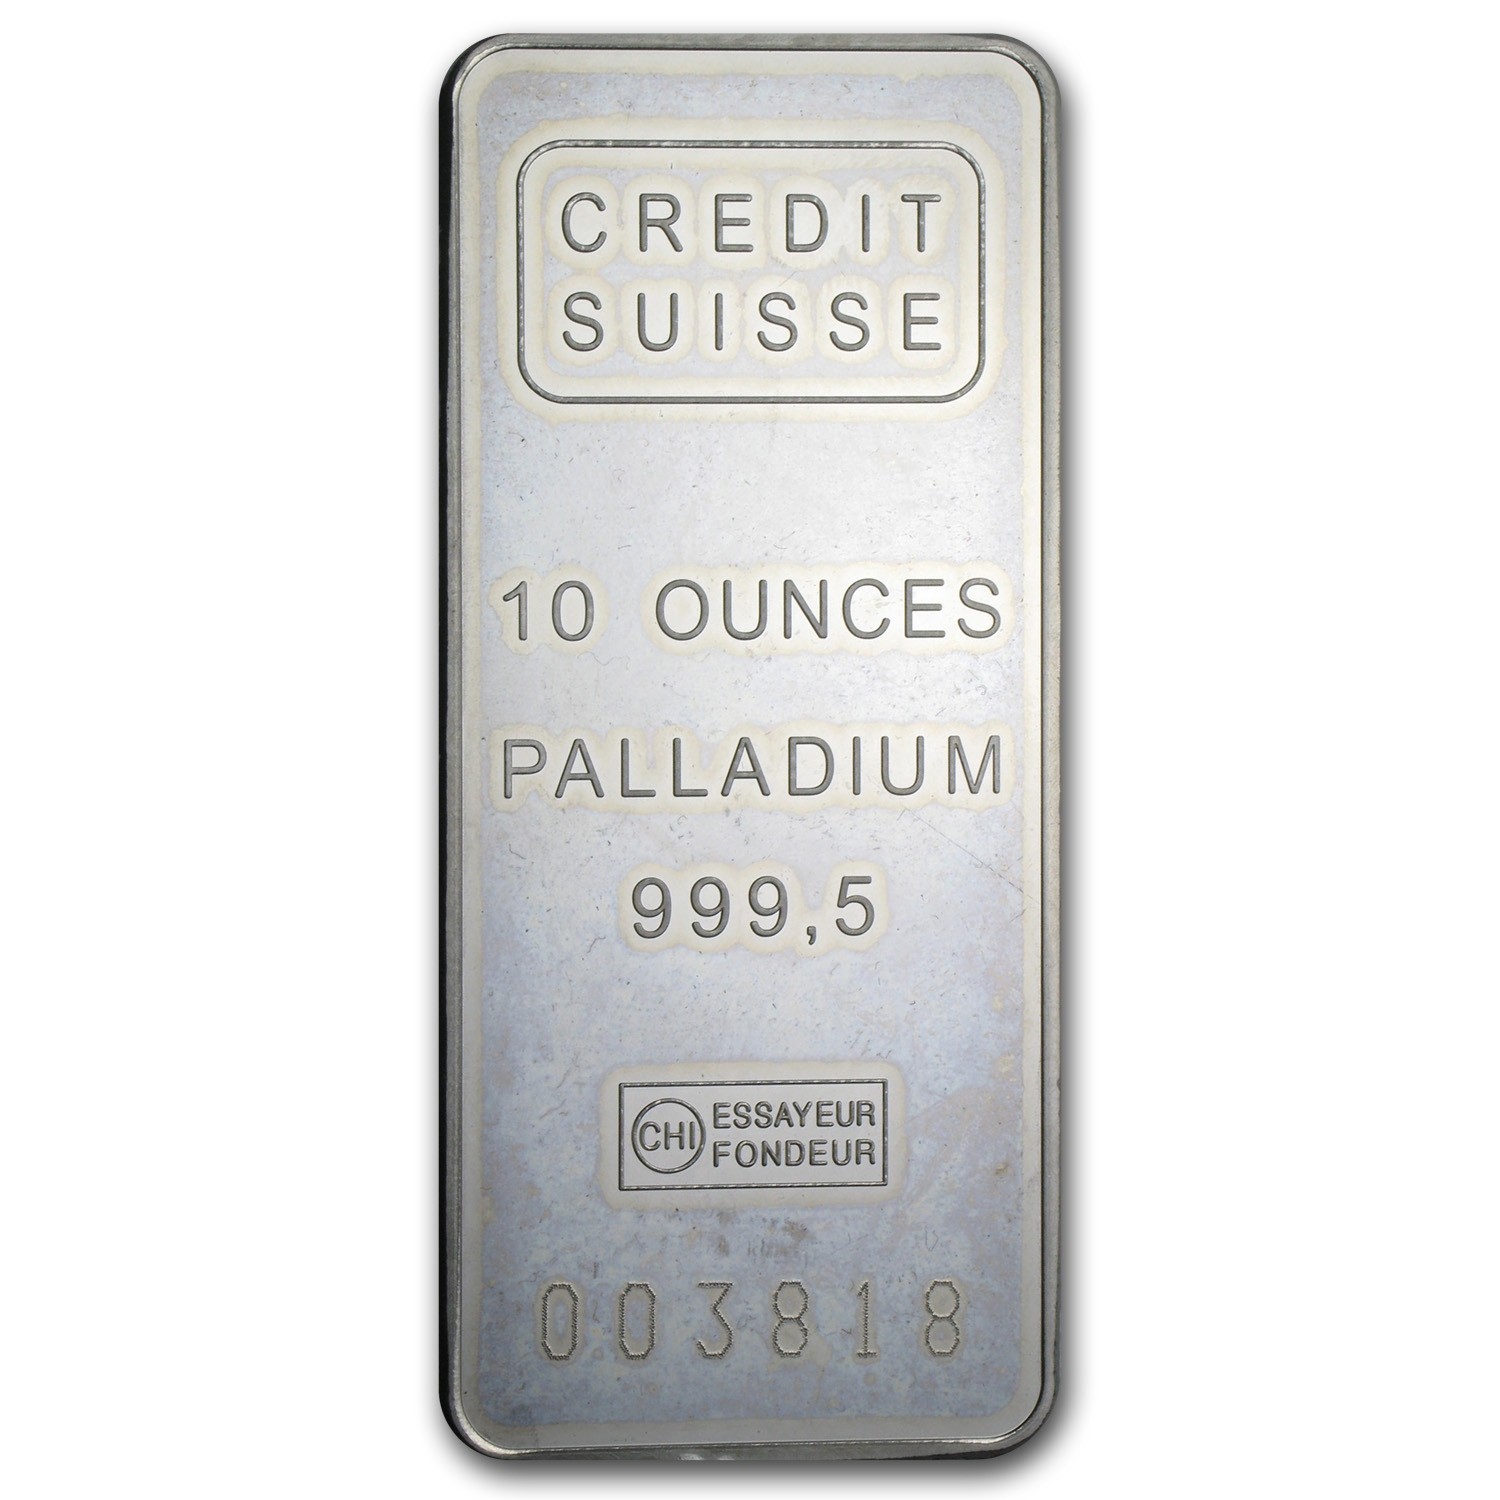
• Palladium broke daily Triangle • Likely to reach 2163.50 Palladium has been rising in the last few trading sessions after the price broke the resistance trendline of the daily Triangle from the middle of April. The breakout of this.
July 17, 2020
• CADCHF reversed from resistance area • Likely to fall to 0.6900 CADCHF recently reversed down from the round resistance level 0.7000 (which also stopped the previous correction (ii)) – standing near the upper daily Bollinger Band The resistance area.

July 17, 2020
• GBPCHF reversed from resistance area • Likely to fall to 1.1725 GBPCHF recently reversed down from the resistance area located between the resistance level 1.1900 (which has been reversing the price from the start of July), upper daily Bollinger.
July 17, 2020
• Morgan Stanley broke key resistance level 51.90 • Likely to rise to 56.50 Morgan Stanley recently broke above the key resistance level 51.90 (former monthly high from June and the reversal pivot from the end of January). The breakout.

July 16, 2020
• GBPAUD reversed from support level 1.7935 • Likely to rise to 1.8200 GBPAUD today reversed up from the strong support level 1.7935 (which has been steadily reversing the price from the middle of June), standing near the lower daily.

July 16, 2020
• S&P 500 reversed from resistance level 3240.00 • Likely to fall to 3110.00 S&P 500 recently reversed down from the pivotal resistance level 3240.00 (former monthly low from January and top of wave (1) from the start of June)..

July 16, 2020
• Soy reversed from support level 876.30 • Likely to rise to 903.20 Soy recently reversed up from the support level 876.30 (former resistance from the middle of June) – standing near the lower daily Bollinger band and the 50%.
July 16, 2020
• EURJPY broke resistance level 122.00 • Likely to rise to 123.00 EURJPY continues to rise inside the sharp impulse wave 3 – which previously broke through the resistance level 122.00 (which stopped the previous waves B and 1). The.

July 16, 2020
• Google reversed from resistance area • Likely to fall to 1475.00 Google recently reversed down from the resistance area standing between the multi-month resistance level 1530.00 (which stopped the sharp uptrend in February) and the upper daily Bollinger Band..

July 16, 2020
Carson Block and Elon Musk can agree on at least one thing: betting against Tesla Inc.’s stock is a bad idea. Block, the longtime Musk critic and short-selling founder of Muddy Waters Capital LLC, said on Wednesday that he doesn’t.
July 16, 2020
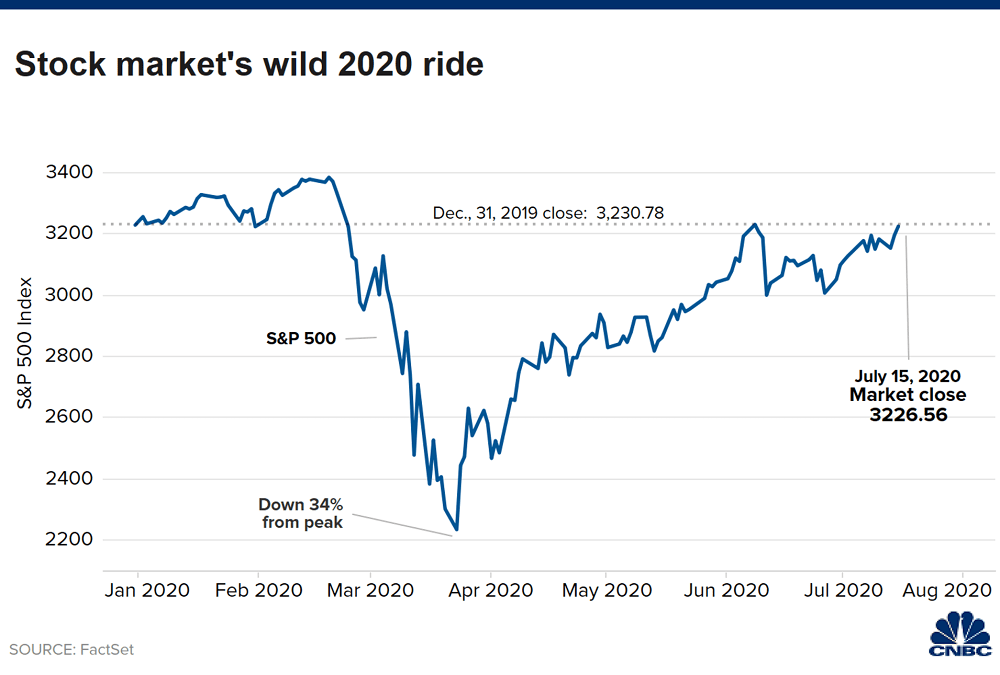
U.S. stock futures pulled back early Thursday, with investors focused on earnings results and sharp losses in Asia shares overnight. Futures on the Dow Jones Industrial Average pointed to a loss of about 200 points at the open. S&P 500.
July 15, 2020
• CADCHF reversed from support zone • Likely to rise to 0.7000 CADCHF today reversed up from the support zone located between the pivotal support level 0.6900 (which has been reversing the price from May), lower daily Bollinger band and.