


Technical analysis - Page 373

August 31, 2020
• EURGBP reversed from support level 0.8915 • Likely to rise to 0.9000 EURGBP recently reversed up from the pivotal support level 0.8915 (which also revered the price in the middle of June). The support zone near the support level.
August 31, 2020
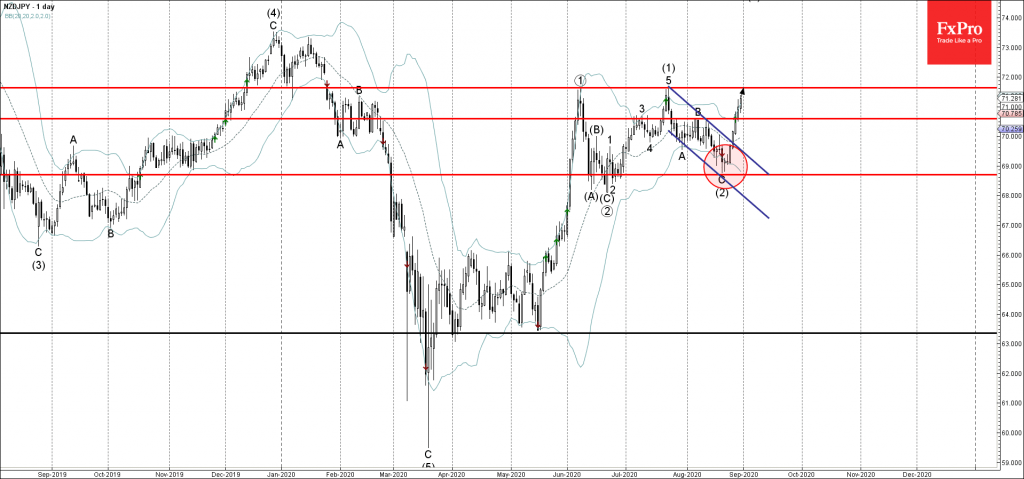
• NZDJPY broke key resistance level 70.60 • Likely to rise to 71.60 NZDJPY recently broke the key resistance level 70.60 – top of the B-wave of the previous ABC correction (2) from the middle of July. The breakout of.

August 31, 2020
• AUDJPY broke resistance level 76.45 • Likely to rise to 78.90 AUDJPY continues to rise inside the upward impulse wave C which recently broke the key resistance level 76.45 (which has been steadily reversing the price from the end.

August 31, 2020
• Wheat broke key resistance level 550.00 • Likely to rise to 570.00 Wheat opened today with the upward gap breaking above the key resistance level 550.00 (which stopped the (a)-wave of the active ABC correction 2 in the middle.

August 28, 2020
• AUDUSD broke resistance level 0.7250 • Likely to rise to 0.7400 AUDUSD recently broke sharply above the resistance level 0.7250 (which stopped the two previous impulse waves (5) and (1) – as can be seen from the daily AUDUSD.

August 28, 2020
• Gold rising inside daily up channel • Likely to rise to 2000.00 Gold recently reversed once again from the support trendline of the wide daily up channel from March (like it did earlier this month). The support zone near.

August 28, 2020
• AUDCAD broke daily down channel • Likely to rise to 0.9655 AUDCAD recently broke the resistance trendline of the daily down channel from July (which enclosed the previous ABC correction (A)). The breakout of this down channel coincided with.

August 28, 2020
• EURJPY reversed from resistance level 126.70 • Likely to fall to 124.40 EURJPY recently reversed down exactly from the resistance level 126.70 (which stopped the previous minor impulse wave (i) at the start of August). The resistance zone near.

August 28, 2020
• NZDCAD broke resistance level 0.8800 • Likely to rise to 0.8900 NZDCAD continues to rise inside the sharp upward impulse wave ③, breaking today the resistance level 0.8800 (former support from the start of August). The breakout of the.
August 27, 2020
• Soy broke key resistance level 930.00 • Likely to rise to 950.00 Soy recently broke above the key resistance level 930.00 (previous upward target), intersecting with the resistance trendline of the daily up channel from April. The breakout of.

August 27, 2020
• Natural gas rising inside impulse wave C • Likely to rise to 2,880 Natural gas continues to rise strongly inside the sharp upward impulse wave C – which belongs to the multi-month ABC correction (2) from the end of.

August 27, 2020
• EURCAD broke support level 1.5510 • Likely to fall to 1.5360 EURCAD today broke the support level 1.5510, intersecting with the 50% Fibonacci correction of the upward impulse 1 from June. The breakout of the support level 1.5510 accelerated.