


Technical analysis - Page 106

July 2, 2025
Silver: ⬆️ Buy – Silver reversed from support level 35.50 – Likely to rise to resistance level 37.30 Silver recently reversed up with the daily Hammer from the support level 35.50 (which stopped the previous waves (iv) and 4, as.
July 2, 2025
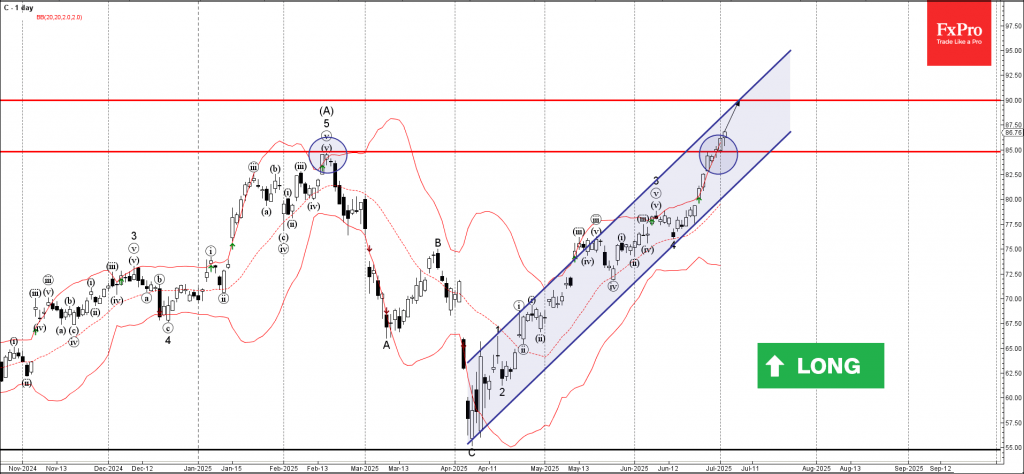
Citigroup: ⬆️ Buy – Citigroup broke key resistance level 85.00 – Likely to rise to resistance level 90.00 Citigroup recently broke above the key resistance level 85.00 (former multi-month high from February, which stopped the previous wave (A), as can.

July 2, 2025
EURGBP: ⬆️ Buy – EURGBP broke resistance zone – Likely to rise to resistance level 0.8700 EURGBP currency pair recently broke the resistance zone between the resistance level 0.8570 (which stopped the previous impulse wave i at the end of.

July 2, 2025
GBPJPY: ⬇️ Sell – GBPJPY reversed from resistance zone – Likely to fall to support level 193.85 GBPJPY currency pair recently reversed down from the resistance zone between the strong resistance level 199.000 (which has been reversing the price from.

July 2, 2025
Nikkei 225: ⬇️ Sell – Nikkei 225 reversed from resistance zone – Likely to fall to support level 39000.00 Nikkei 225 index recently reversed down with the Evening Star from the resistance zone between the resistance levels 40000.00 and 40550.00.

July 2, 2025
Bank of America: ⬇️ Sell – Bank of America reached resistance level 48.00 – Likely to fall to support level 46.00 Bank of America recently reached the powerful multi-month resistance level 48.00, which has been reversing the price from last.

July 1, 2025
Trip: ⬆️ Buy – Trip broke daily down channel – Likely to rise to resistance level 14.50 Trip recently broke the resistance trendline of the daily down channel from the start of May (inside which the price has been falling.
July 1, 2025
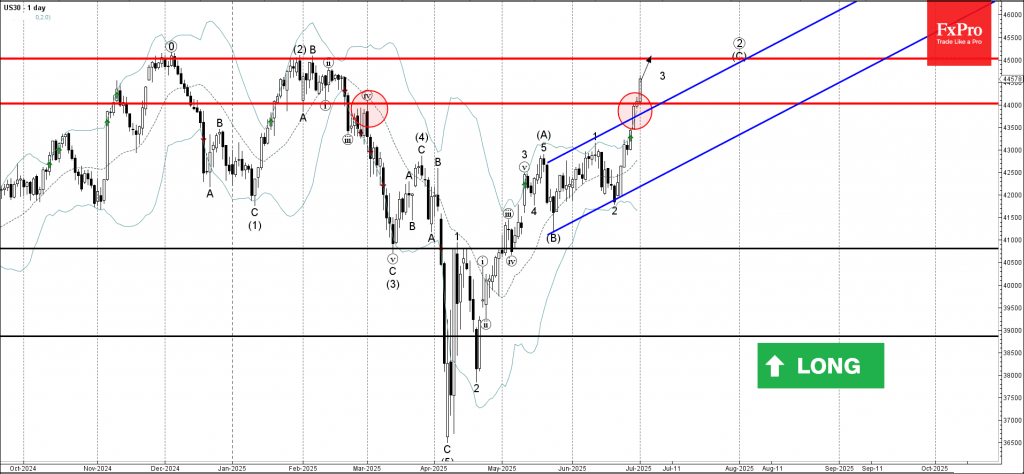
Dow Jones: ⬆️ Buy – Dow Jones broke the resistance zone – Likely to rise to resistance level 45000.00 Dow Jones index recently broke the resistance zone located at the intersection of the resistance level 44000.00 (former top of wave.

July 1, 2025
We are breaking down what’s really driving the markets right now — and why investors are reacting the way they are.

July 1, 2025
CHFJPY: ⬆️ Buy – CHFJPY broke long-term resistance level 180.00 – Likely to rise to resistance level 185.00 CHFJPY currency pair continues to rise after the pair broke above the long-term resistance level 180.00 (former yearly high from the middle.

July 1, 2025
Apple: ⬆️ Buy – Apple broke resistance zone – Likely to rise to resistance level 213.40 Apple recently broke the resistance zone between the resistance level 203.00 (which has been reversing the price from the start of June) and the.
June 30, 2025
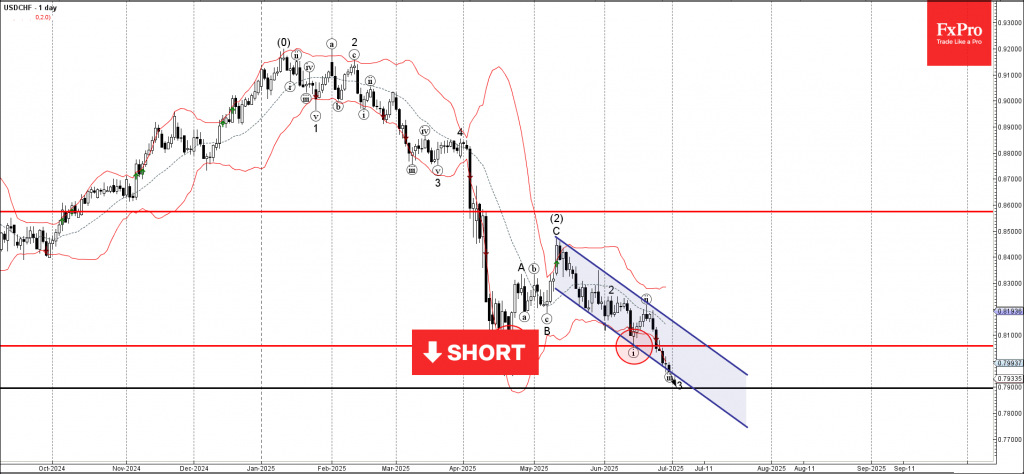
USDCHF: ⬇️ Sell – USDCHF falling inside a minor impulse wave – Likely to fall to support level 0.7900 USDCHF currency pair is falling strongly inside the minor impulse wave 3, which recently broke the daily down channel from the.