


Weekly round-up: dollar takes a step back, S&P 500 faces a key test, gold and Bitcoin in a nosedive
November 19, 2026 @ 19:02 +03:00
by /  Add FxPro.News on Google
Add FxPro.News as your preferred source to see more of our posts on Google.
- The dollar retreated from 19-month highs on profit-taking and falling oil prices.
- The S&P 500 dipped below its 200-day moving average five times this month but each time recovered above it.
- Gold and Bitcoin are falling alongside equities: gold is at 14-month lows, and Bitcoin has erased its August gains.
Dollar
The US dollar retreated from 19-month highs amid profit-taking on long positions following an impressive rally over the previous two weeks. The market is once again dismissing the idea of a 50-basis-point hike in the federal funds rate at the Fed’s final meeting of 2026. Even FOMC member Christopher Waller, who had previously advocated such a move, is now proposing a two-step tightening of 25 basis points each, in December and January.
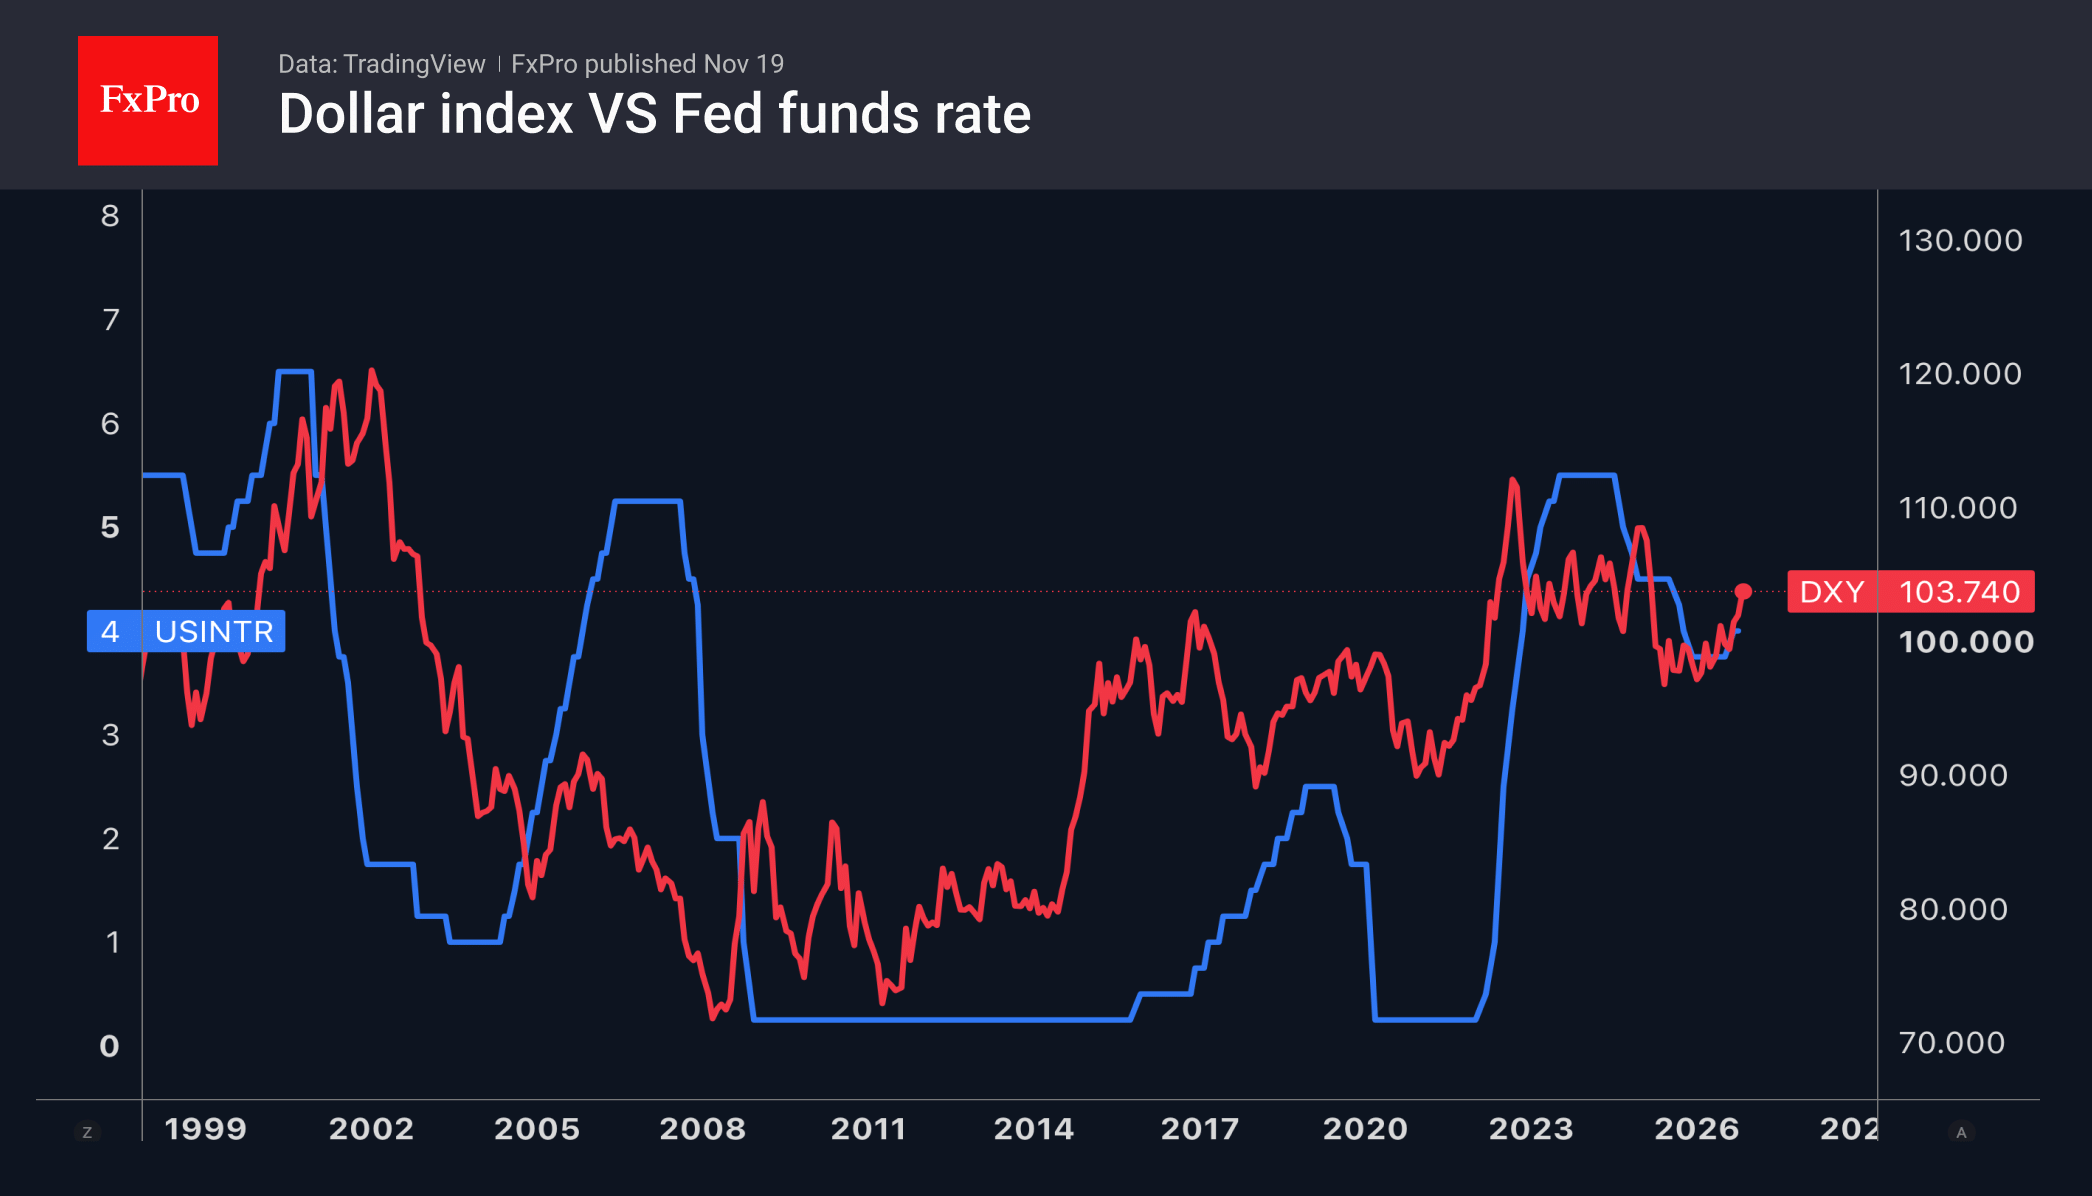
Source: TradingView, as of 19 November 2026.
Pressure on the greenback is coming from Brent crude, which has lost 4.5% since the start of the week amid expectations that the oil market will move into surplus, as well as from falling Treasury yields. It is possible that signs of stabilisation in the equity market, fuelled by renewed optimism about AI following Nvidia’s strong corporate results and Anthropic’s successful IPO, are also weighing on the dollar.
Stocks
The S&P 500 has recorded a five-day losing streak, its worst since June, and despite Nvidia‘s strong financial results, investors attribute them to the performance of former CEO Jensen Huang. Furthermore, investigations into the company and new restrictions on chip exports to China are casting doubt on whether its ambitious revenue targets can be met.
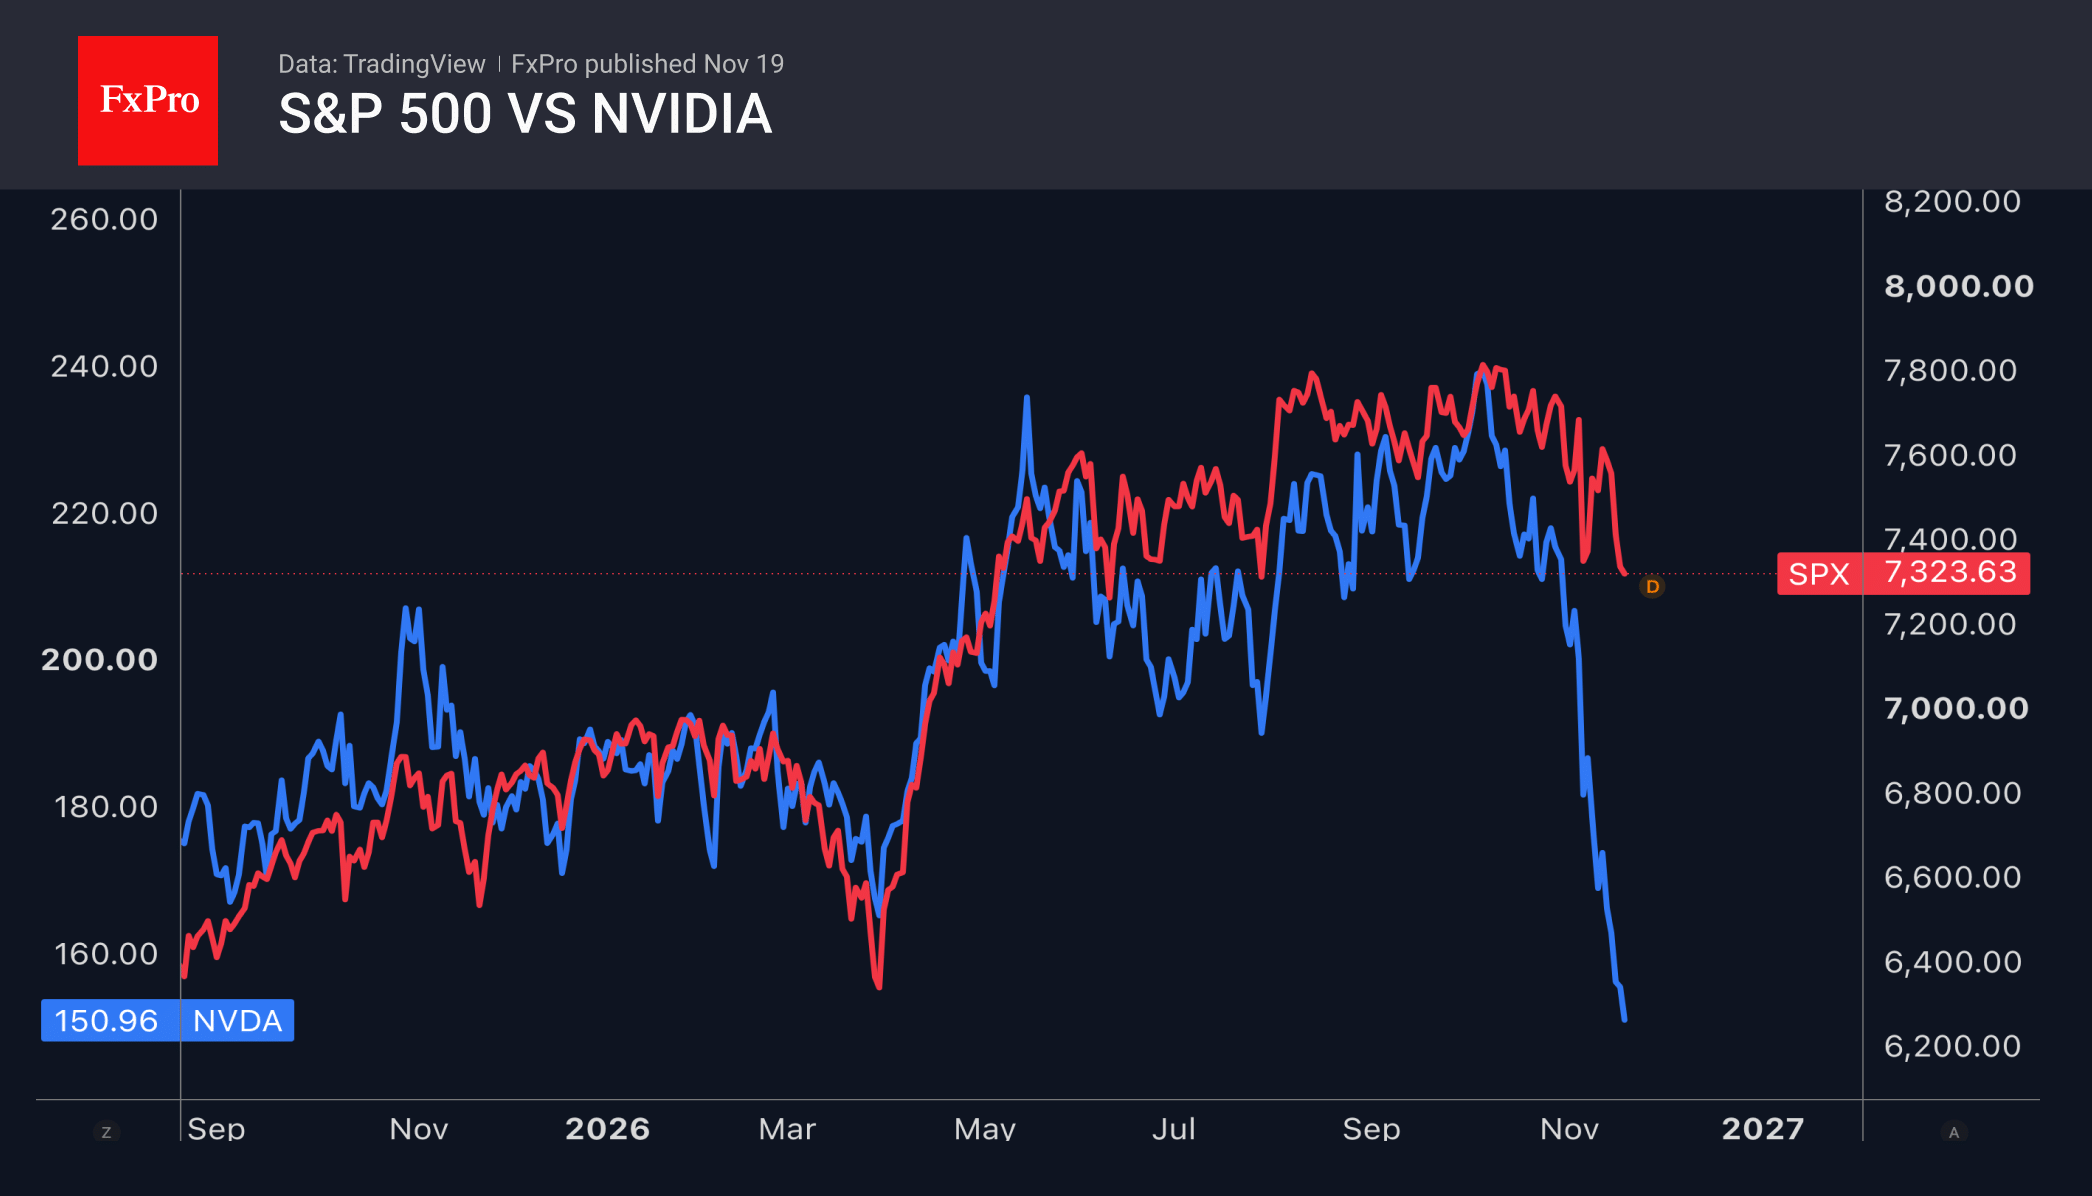
Source: TradingView, as of 19 November 2026.
A strong start to trading in Anthropic shares could consolidate this success and reignite interest in AI. Bloomberg experts are full of optimism. They forecast a 9% rise in the S&P 500 to 7,952 by the end of 2027. Corporate profits are expected to grow by 29% in 2027, the strongest performance since 2021.
Hopes are fuelling the market at a technically significant juncture. The S&P 500 has dipped below its 200-day moving average intraday five times since the start of the month but has rebounded above this key long-term trend line each time. Weak trading on Wednesday gave way to a confident rise in futures on Thursday. Still, in our view, it is best to wait for the close of the week or a pullback of 2–3% from current levels before drawing any definitive conclusions about the prevailing trend.

Gold
Gold has plummeted to 14-month lows and is behaving like a risky asset rather than a safe haven. The increased correlation between metals and stock indices makes portfolio diversification difficult. It is not uncommon for a fall in the S&P 500 to intensify selling of the precious metal, as investors seek liquidity to meet margin requirements on stock positions.
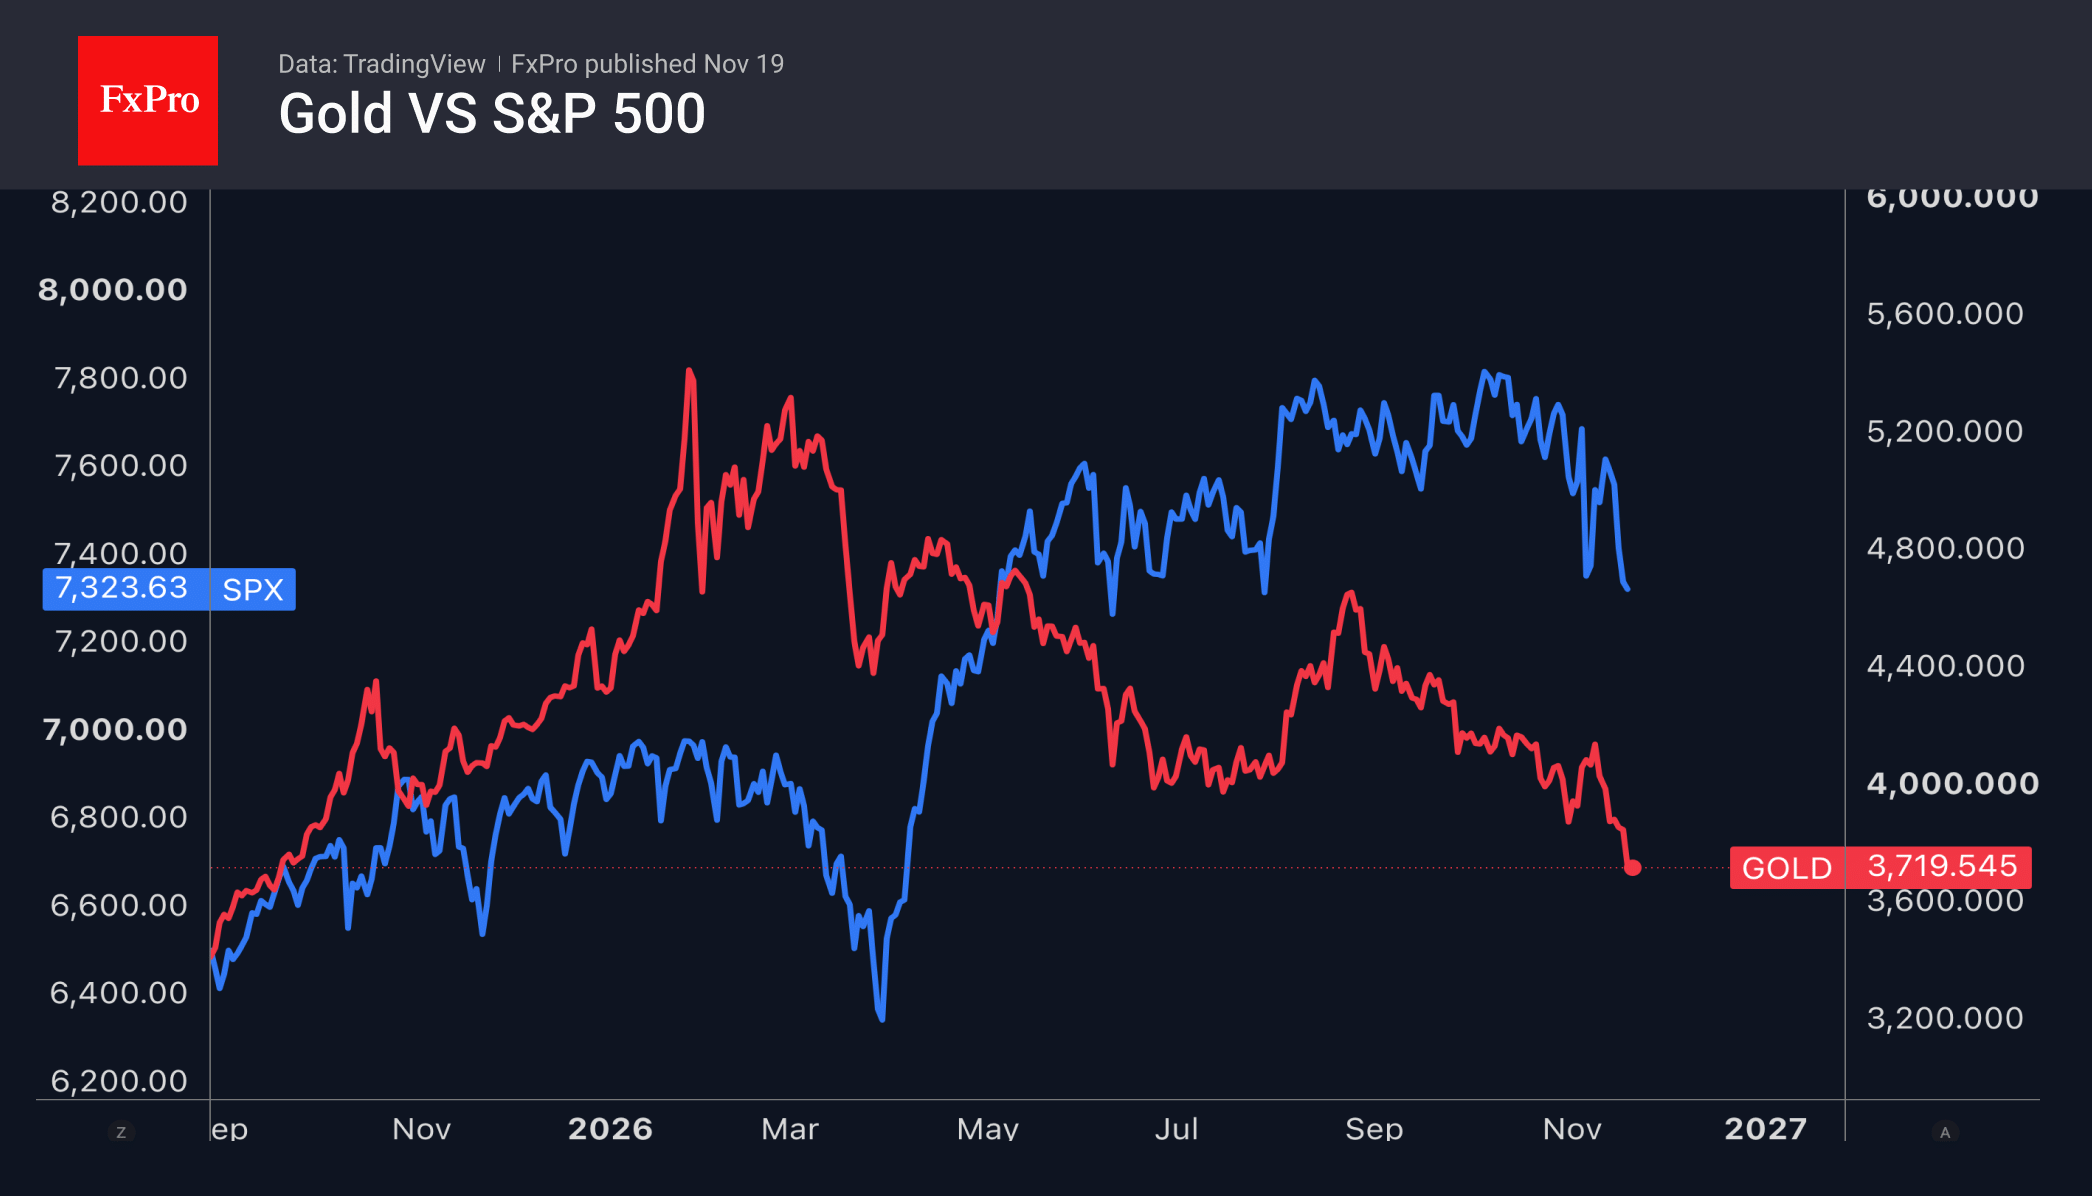
Source: TradingView, as of 19 November 2026.
One of the factors behind gold’s slump is the fading of the “debasement trade”, where investors sell currencies and bonds in favour of real assets such as gold and Bitcoin. A resurgence of interest in the dollar and a rise in 10-year Treasury yields above 5% are creating formidable competitors for the precious metal.
Crypto
Bitcoin has wiped out all its gains since August, when Scott Bessent’s statement regarding US intervention in the debt market triggered a rally in BTCUSD to its September highs, driven by the “debasement trade”. The cryptocurrency is experiencing significant capital outflows. According to Farside, $2.89 billion was withdrawn from Bitcoin ETFs between 1 and 18 November. This month has been the worst so far this year.
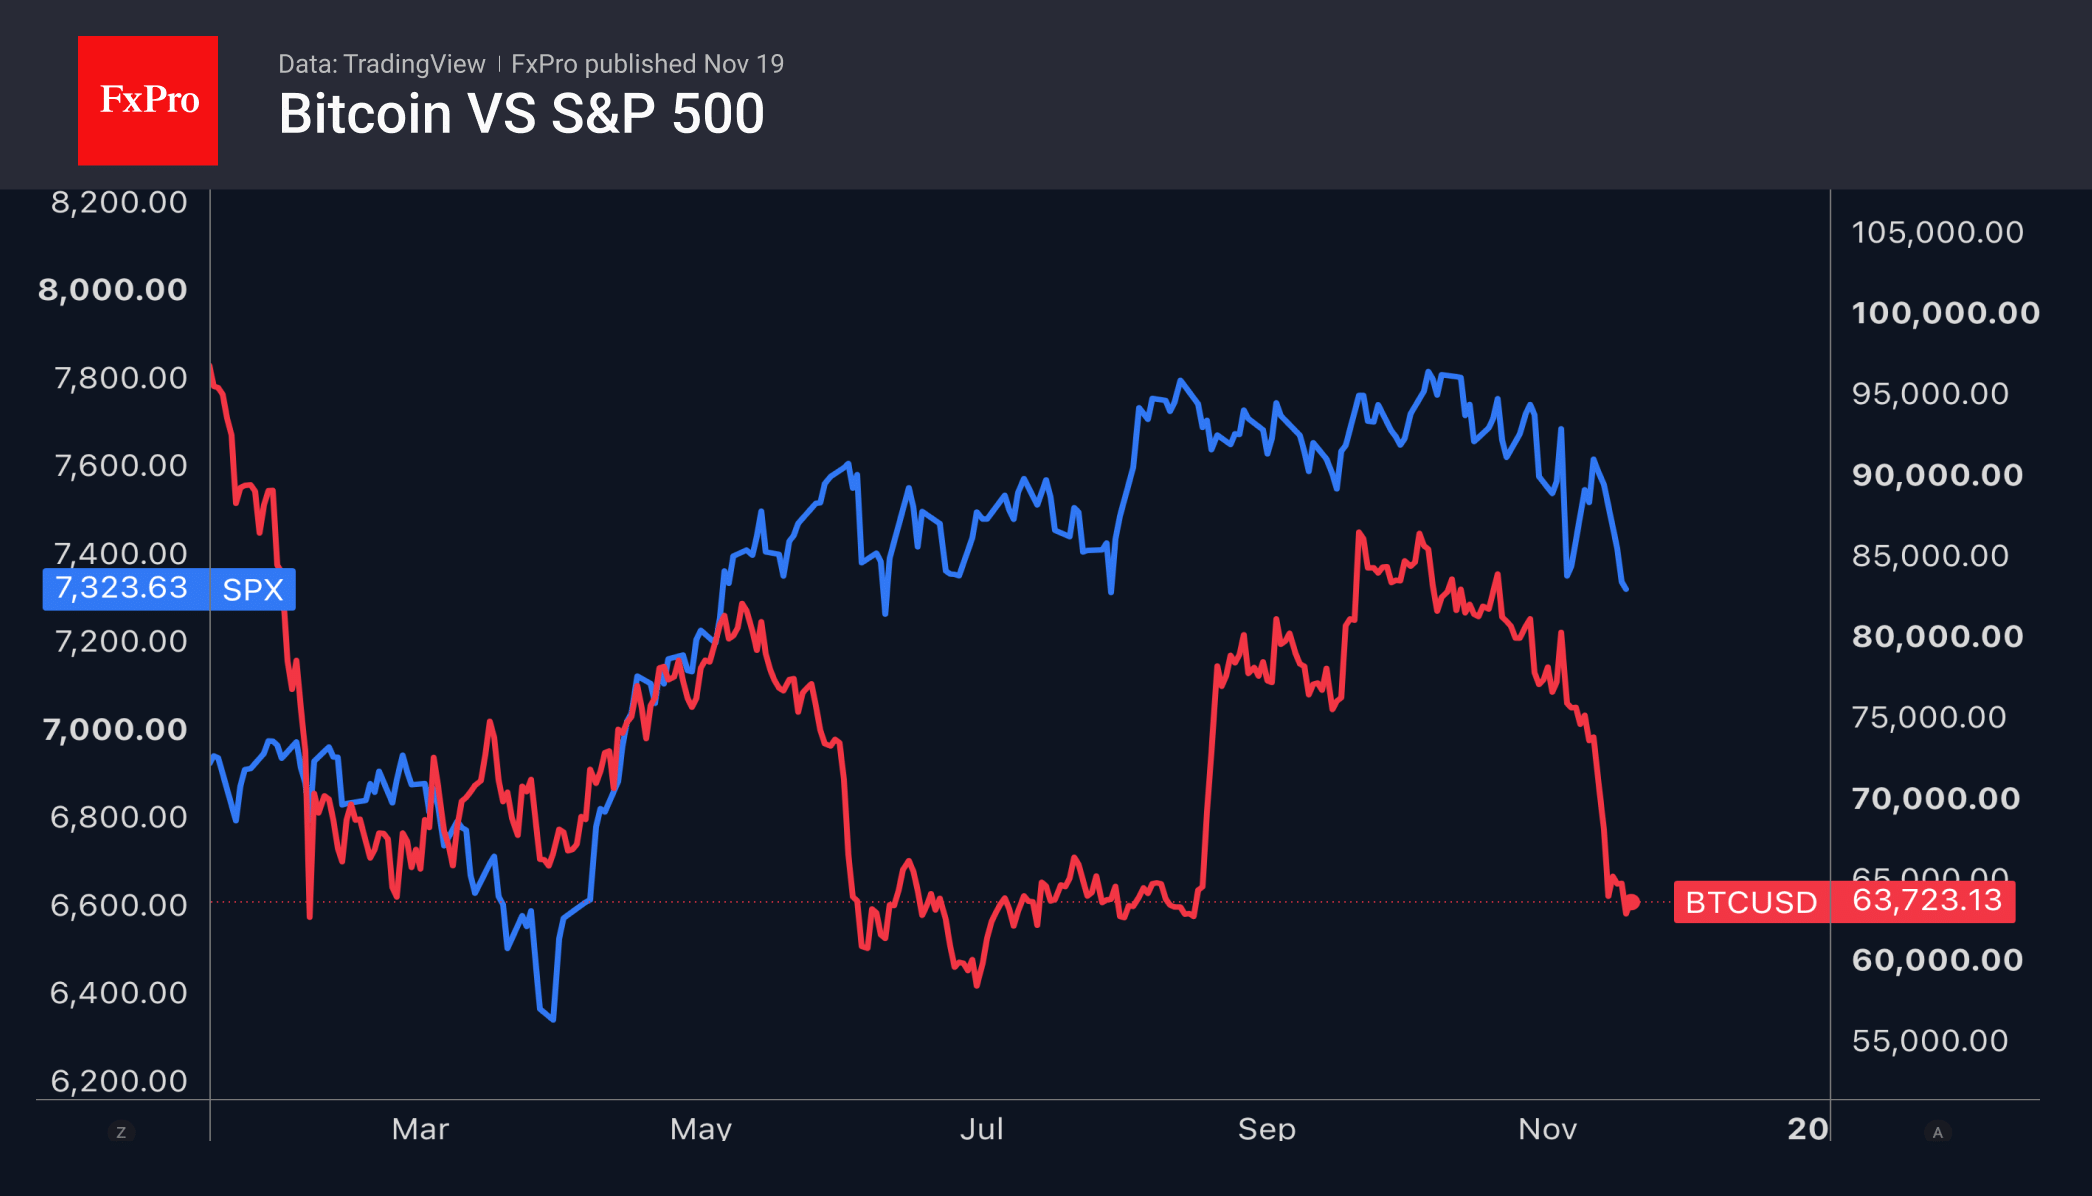
Source: TradingView, as of 19 November 2026.
Glassnode notes that holders of tokens purchased within the last six months took profits during the BTCUSD rally in August–September, and are now back in the red, just as they were at the start of the year. Meanwhile, the flow of capital from the crypto market into equities, including interest in Anthropic, is putting pressure on coins.
What is next?
Business activity data across various regions, including the US and the eurozone (23 November), US personal consumption expenditures and GDP data (25 November), and the account of the ECB’s October meeting (26 November) will be the key events on the economic calendar for the last full week of autumn.
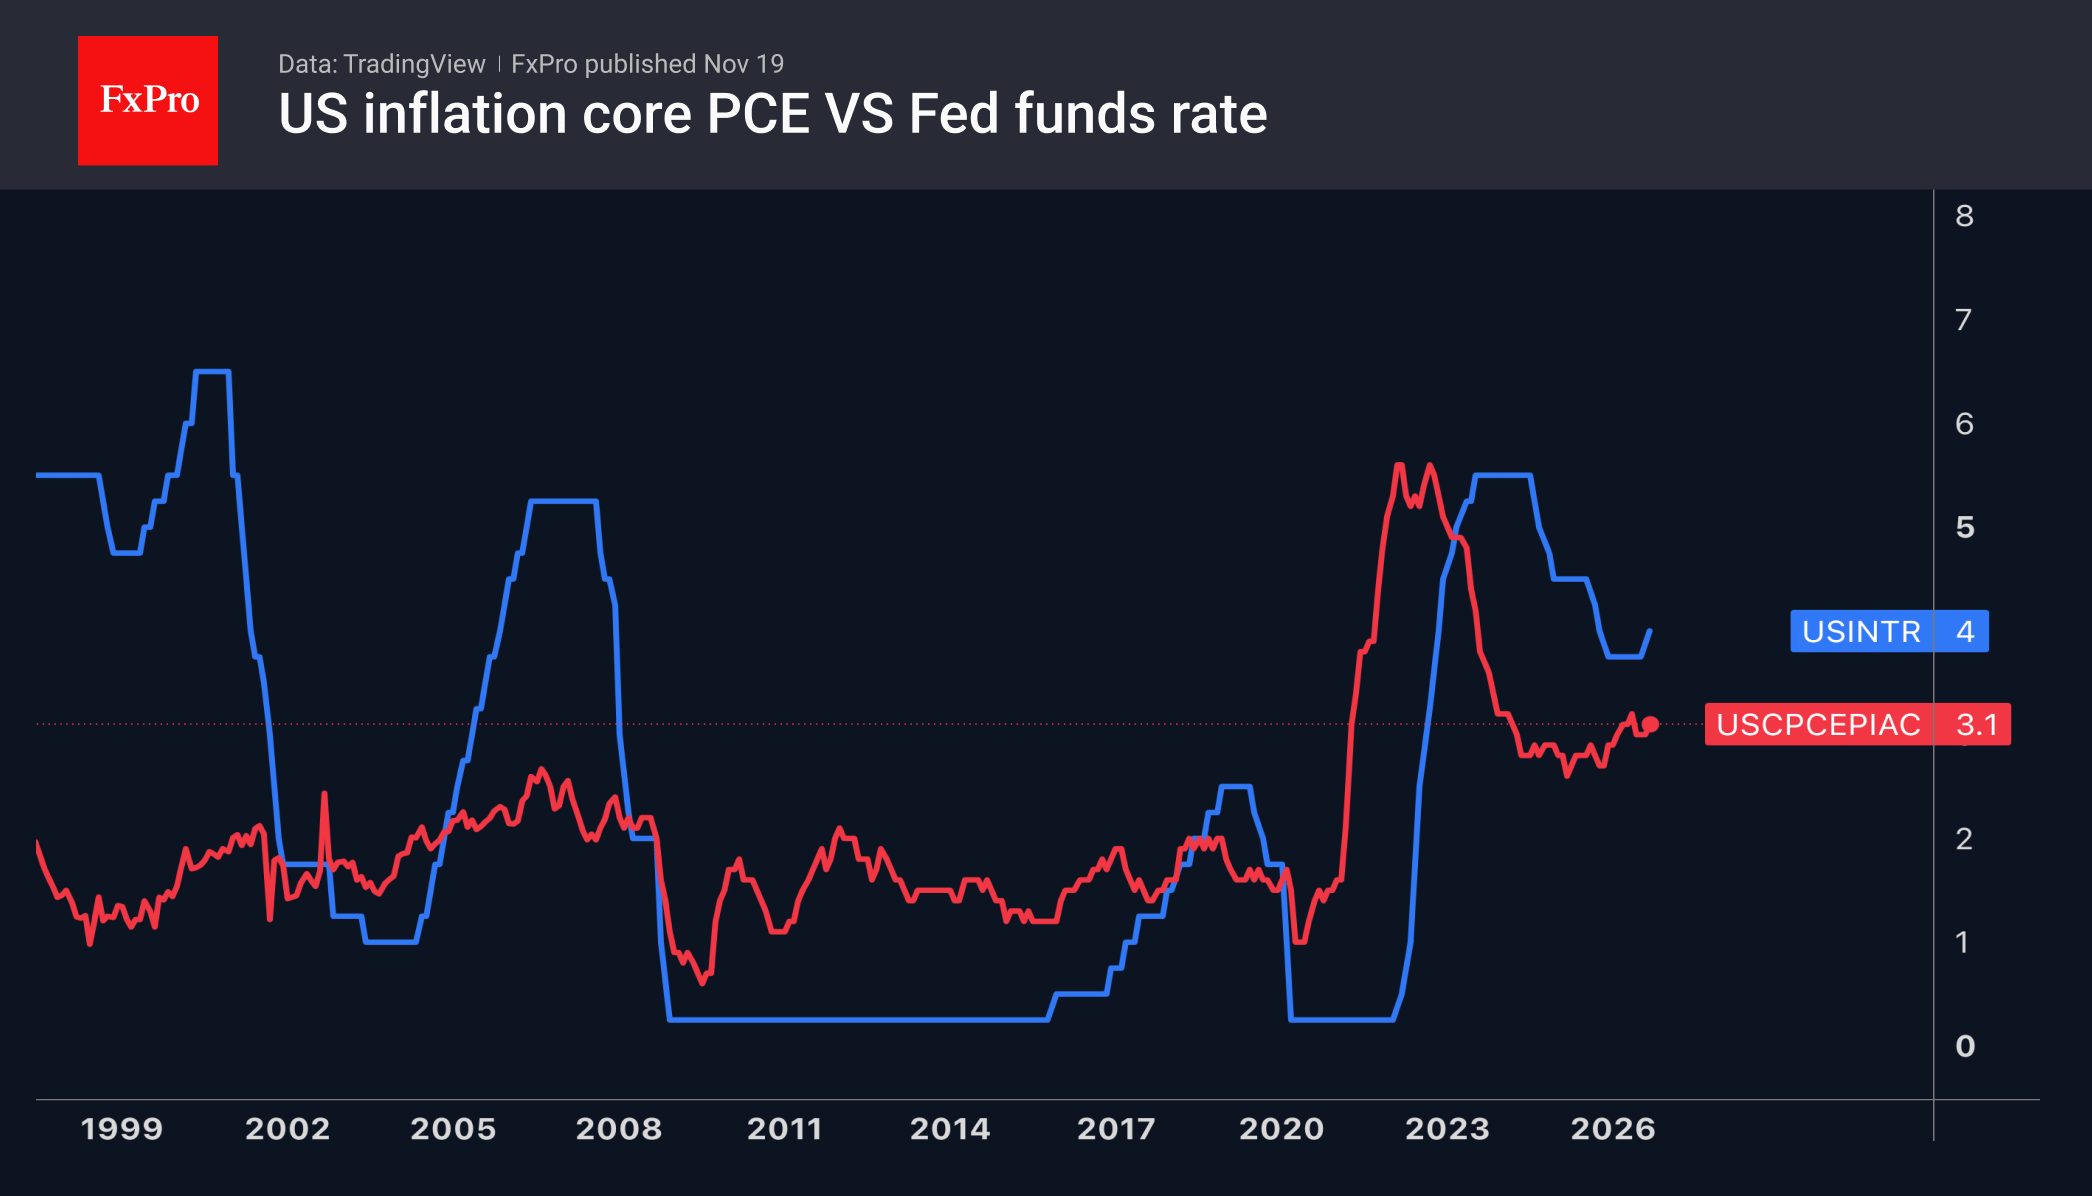
Source: TradingView, as of 19 November 2026.
Developments in French politics and the Middle East will continue to keep investors on tenterhooks.
The FxPro Analyst Team