Technical analysis
USDCHF Wave Analysis – 1 June, 2020
June 01, 2020 @ 17:44 +03:00

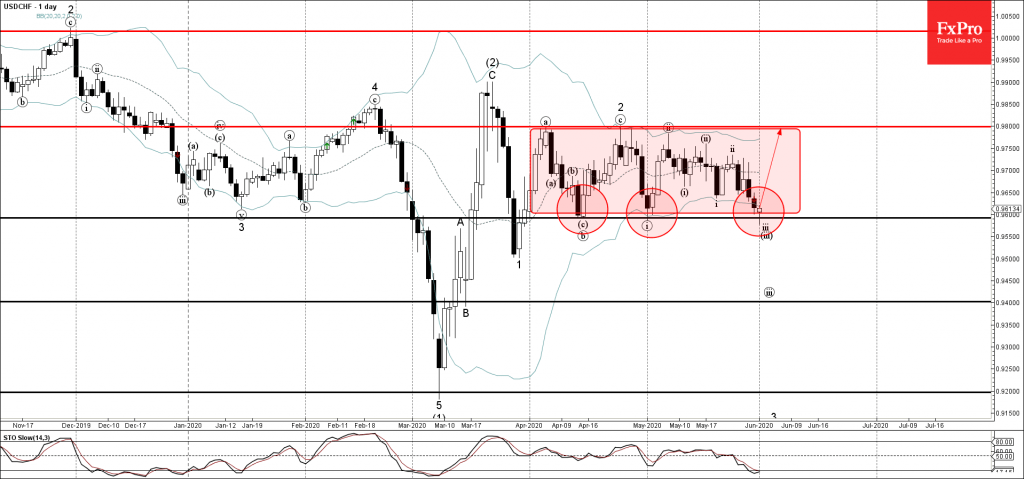
• USDCHF reversed from support level 0.9600
• Likely to rise to 0.9800
USDCHF recently reversed up from the key support level 0.9600 (low of the sideways price range from April), intersecting with the lower daily Bollinger band.
The upward reversal from the support level 0.9600 stopped the earlier short-term impulse wave (iii) – which belongs to the impulse wave 3 from the end of April.
Given the oversold reading on the daily Stochastic indicator – USDCHF is likely to rise further toward the next resistance level 0.9800 (upper boundary of this sideways price range).


