Technical analysis
Sugar Wave Analysis 26 February, 2021
February 26, 2021 @ 18:32 +03:00

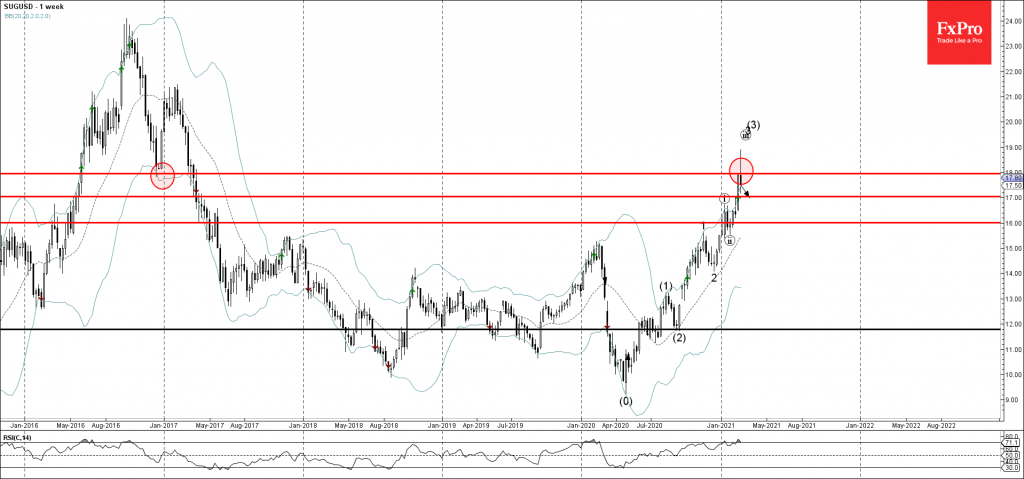
• Sugar reversed from resistance area
• Likely to fall to 17.00
Sugar recently reversed down from the resistance area located between the resistance level 18.00 (former strong support level from the end of 2016) and the upper weekly and daily Bollinger bands.
The downward reversal from this resistance area stopped the previous sharp upward impulse waves (iii), 3 and (3).
Given the still overbought reading on the weekly RSI indicator (rare sell signal) – Sugar is likely to fall down further further toward the next support level 17.00.


