Technical analysis
Soy Wave Analysis – 24 February, 2020
February 24, 2020 @ 16:42 +03:00

- Soy reversed from resistance area
- Likely to fall to 870.00
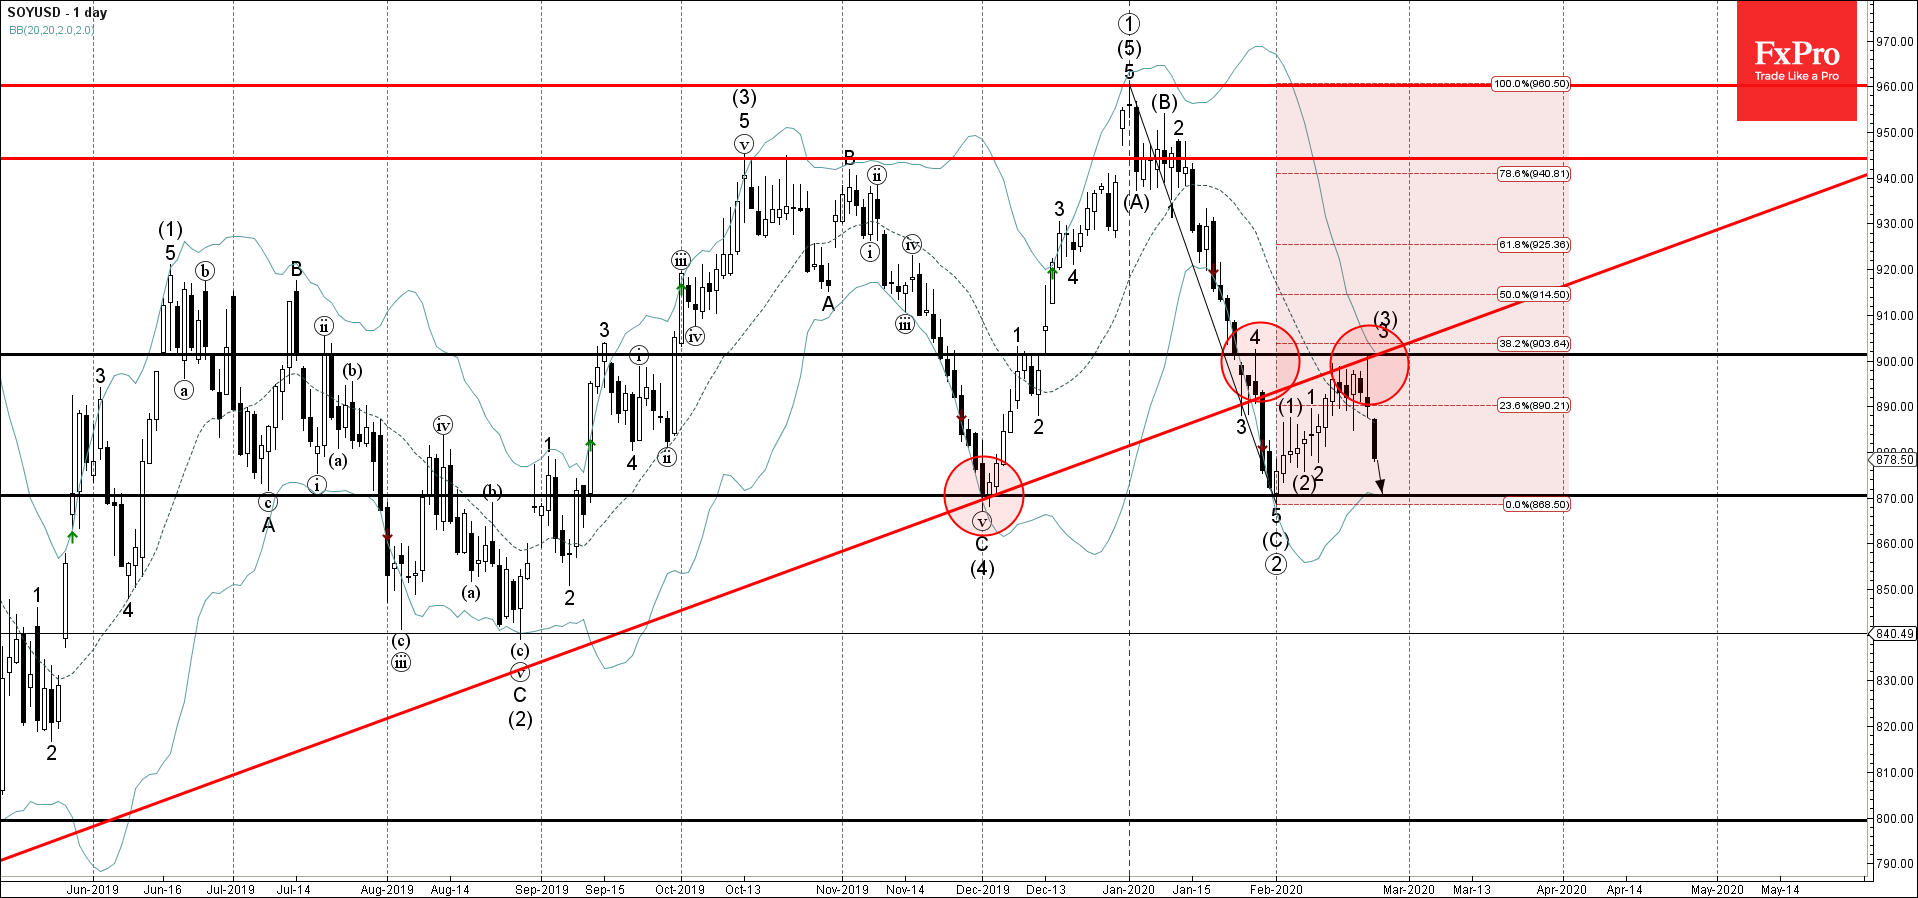
Soy recently reversed down from the resistance area lying at the intersection of the round resistance level 900.00 (top of the previous correction 4 from January), upper daily Bollinger Band, former support trendline from 2019 and the 38.2% Fibonacci correction of the previous downward correction from December.
The downward reversal from this resistance area stopped the earlier impulse waves 3 and (3).
Soy is likely to fall further toward the next support level 870.00 (low of the previous corrections (4) and (C) from November and January).


