Technical analysis
Soy Wave Analysis – 24 December , 2018
December 24, 2018 @ 16:11 +03:00

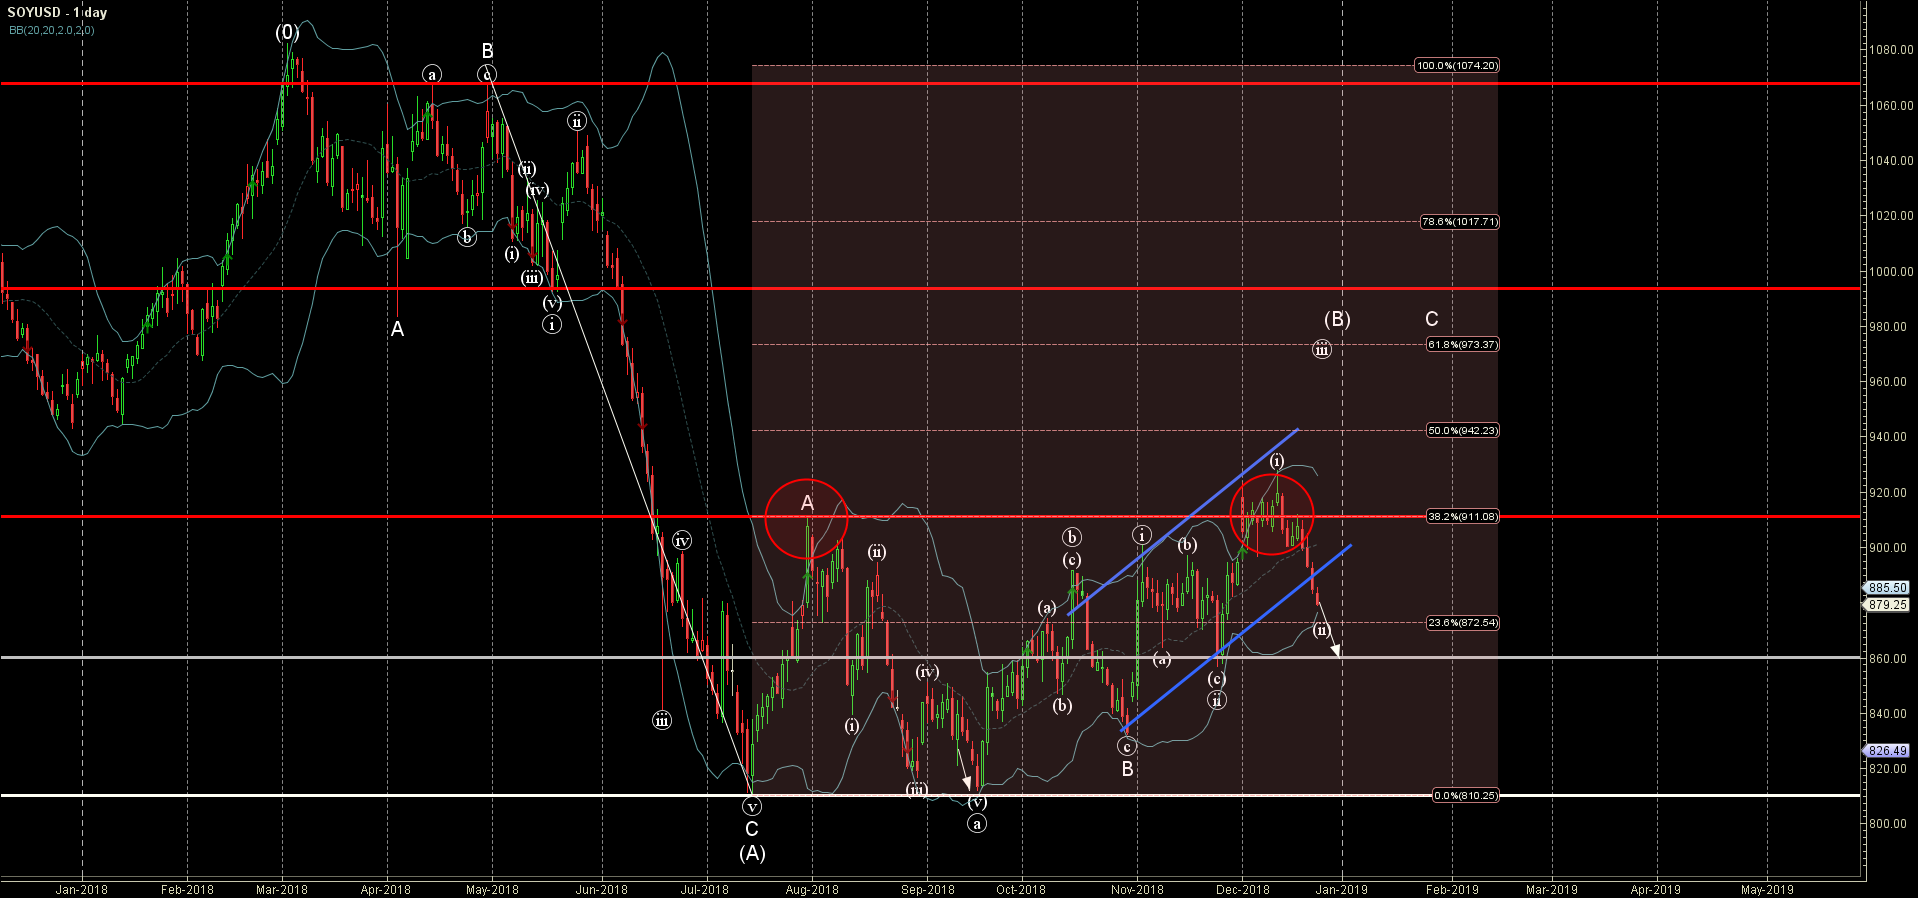
- Soy broke daily up channel
- Further losses are likely
FxPro analyst said that Soy continues to fall inside the short-term corrective wave (ii), which started earlier from the resistance zone lying between the key resistance level 910.00 (monthly high from July), upper daily Bollinger Band and the 38.2% Fibonacci correction of the previous sharp downward impulse from April.
Soy yesterday broke the support trendline of the daily up channel from the end of October – which strengthened the pressure on this instrument.
Soy is expected to fall further and re-test the next support level 860.00 (low of the previous short-term corrections (a) and (c)).


