Technical analysis
Soy Wave Analysis – 10 March, 2020
March 10, 2020 @ 17:44 +03:00

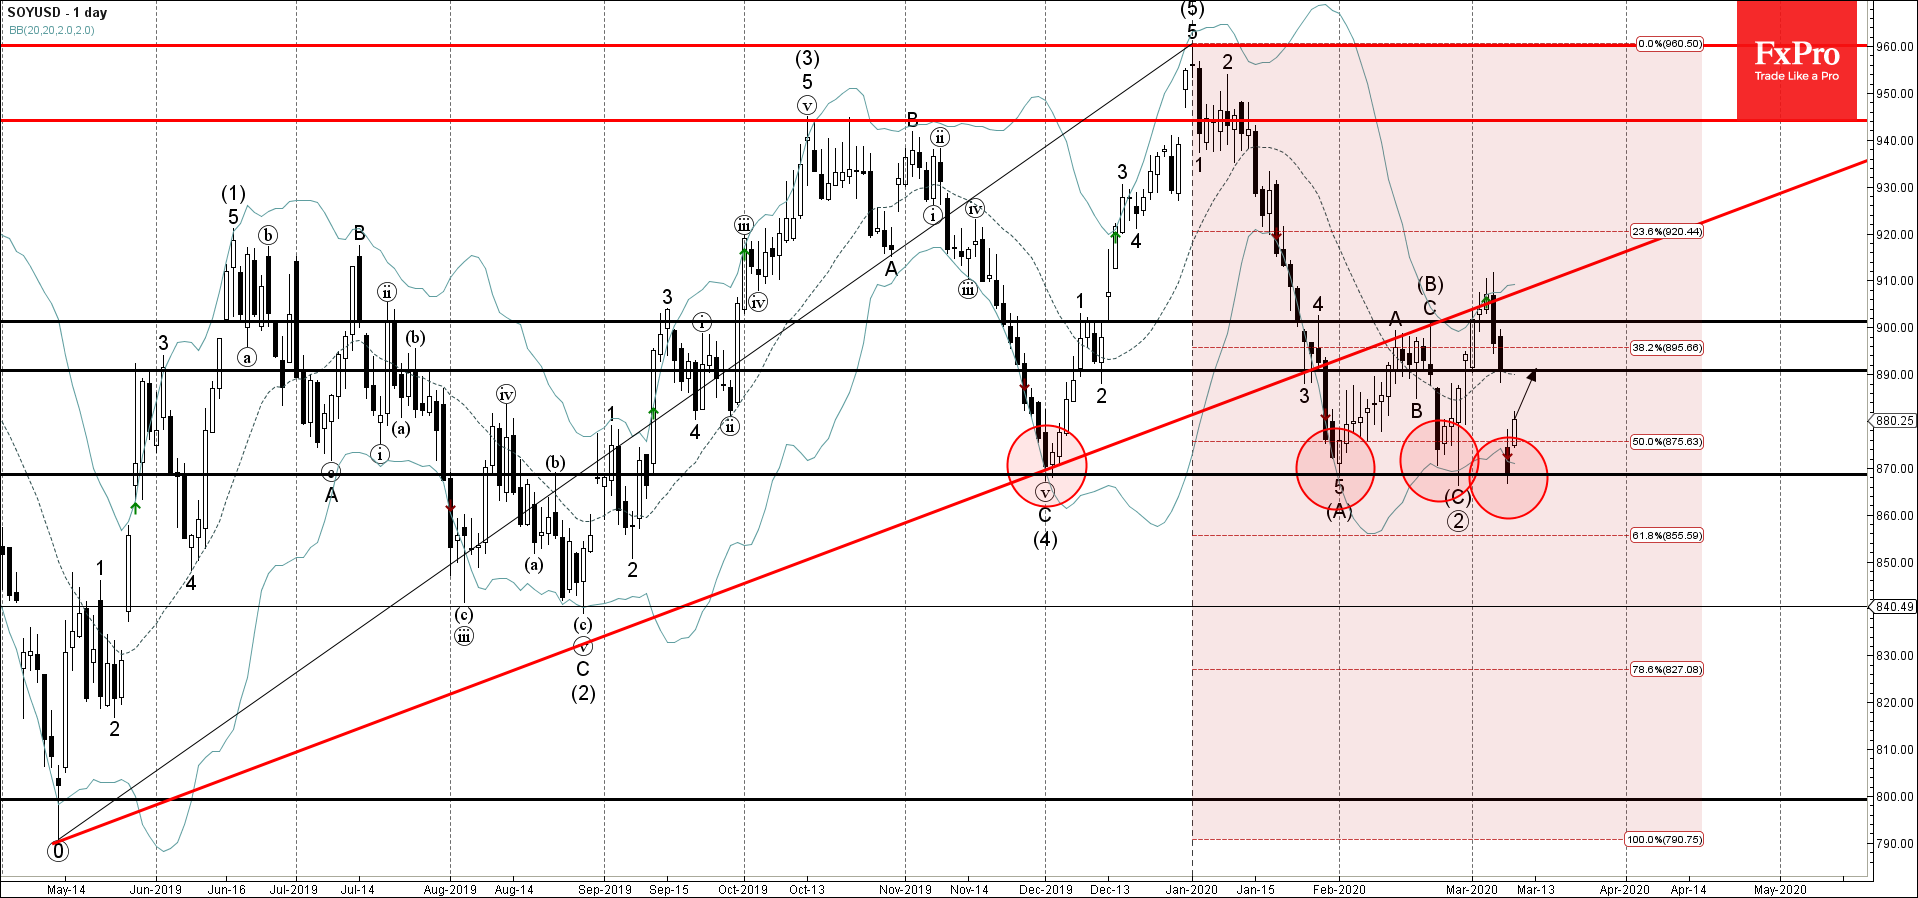
- Soy reversed from support area
- Likely to rise to 890.00
Soy recently reversed up from the support zone located between the powerful multi-month support level 870.00 (which has been reversing the price from November), lower daily Bollinger Band and the 50% Fibonacci retracement of the previous upward impulse from May of 2019.
The upward reversal from this support area is aligned with the prevailing uptrend visible on the daily Soy charts.
Soy is likely to rise further toward the next resistance level 890.00. Strong support remains at the support level 870.00.


