Technical analysis
Philip Morris Wave Analysis – 22 July, 2022
July 22, 2022 @ 18:45 +03:00

• Philip Morris reversed from support area
• Likely to rise to resistance level 96.70
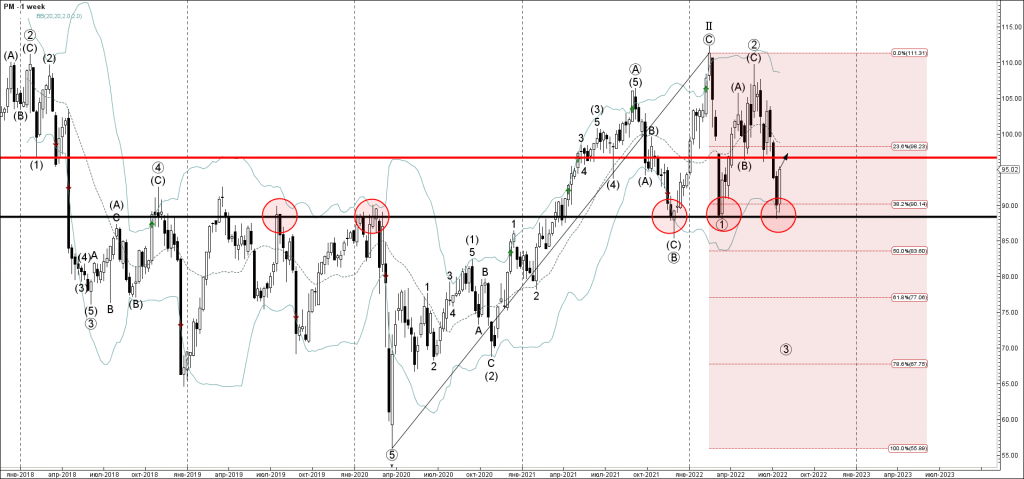
Philip Morris recently reversed up from the support zone located between the pivotal support 88.40 (which has been reversing the price from the end of 2021), standing close to the lower weekly Bollinger Band and the 38.2% Fibonacci retracement of the weekly uptrend from the start of 2020.
The upward reversal from this support area will most likely form the weekly Bullish Engulfing candlesticks reversal patterns– strong buy signal for Philip Morris.
Philip Morris can be expected to rise further toward the next resistance level 96.70 (former low of wave (B) from May).