Technical analysis
NZDUSD Wave Analysis – 04 November, 2019
November 04, 2019 @ 17:01 +03:00

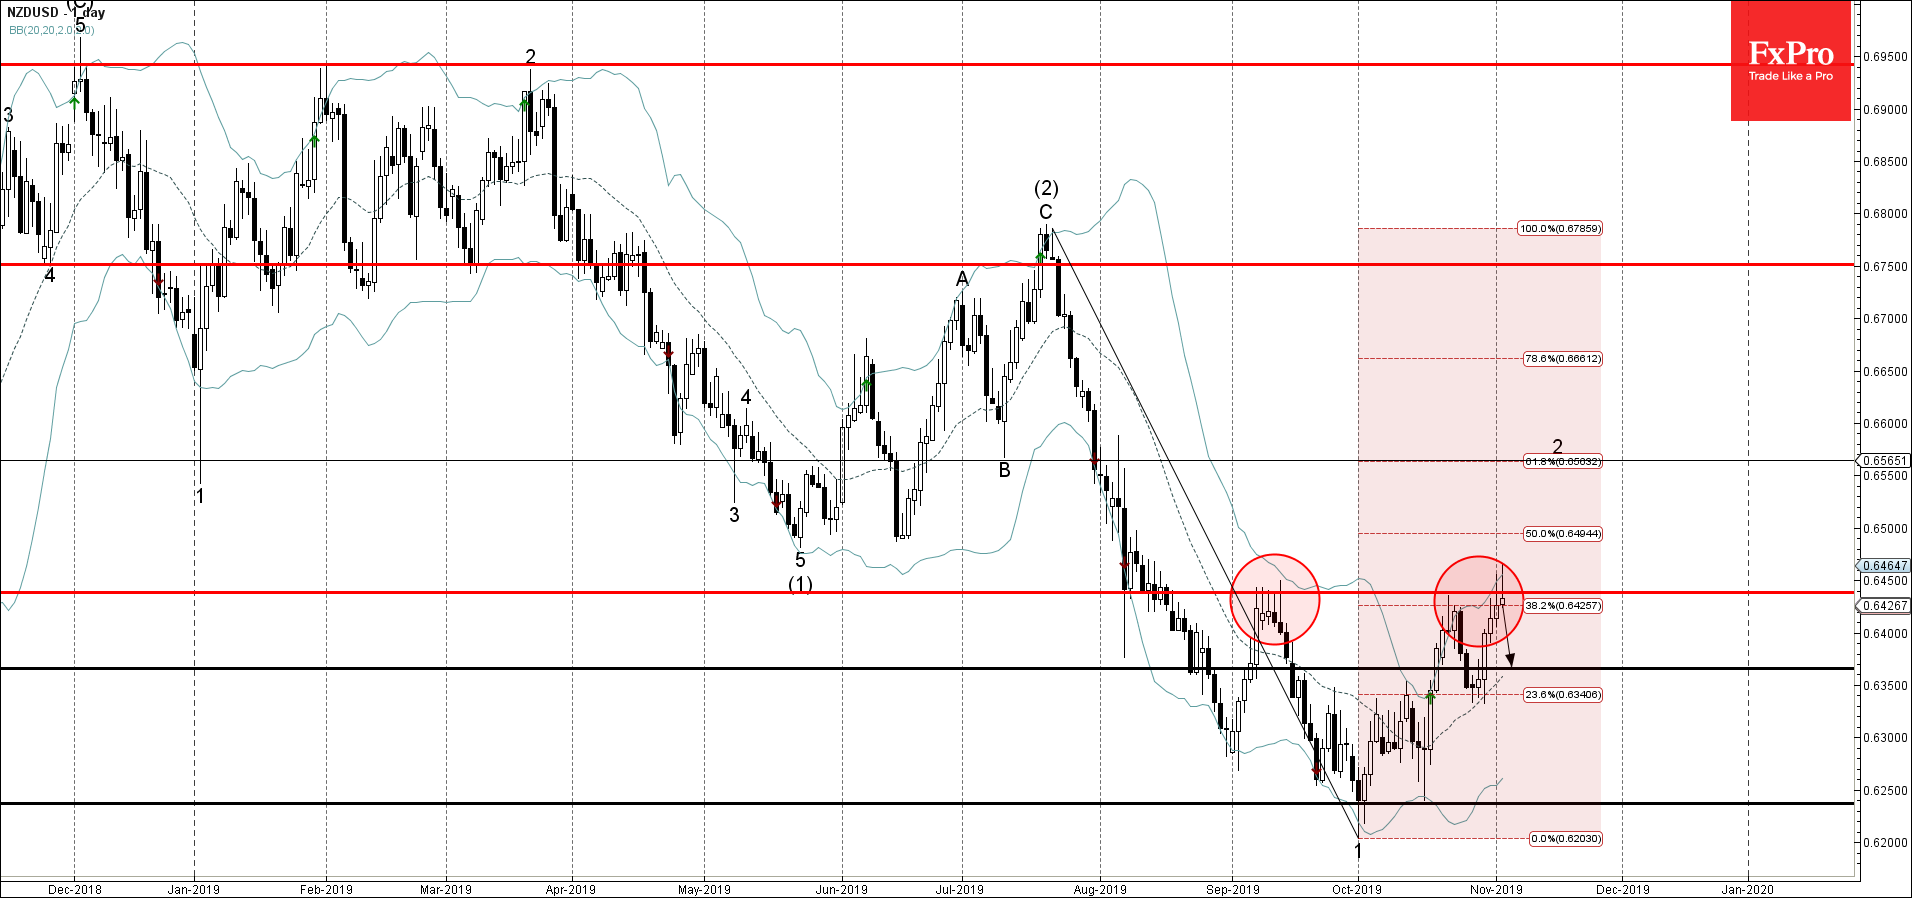
- NZDUSD reversed from resistance zone
- Likely to fall to 0.6350
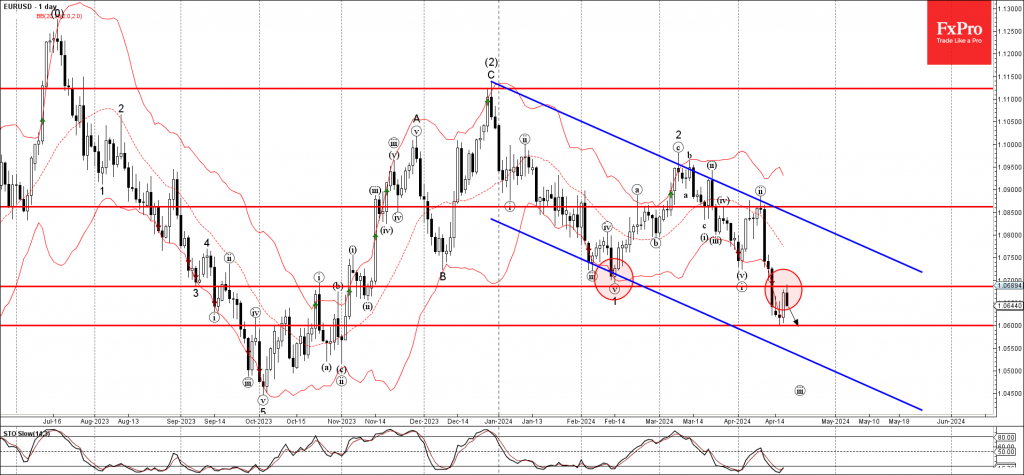
NZDUSD recently reversed down from resistance area lying between the key resistance level 0.6440 (monthly high from September), upper daily Bollinger Band and the 38.2% Fibonacci correction of the previous downward impulse 1 from July.
The downward reversal from this resistance area stopped the earlier medium-term corrective wave 2.
NZDUSD is expected to fall further and retest the next support level – 0.6350 (low of the previous correction from the end of October).


