


Technical analysis
Novartis Wave Analysis – 28 August 2026
August 28, 2026 @ 16:30 +03:00
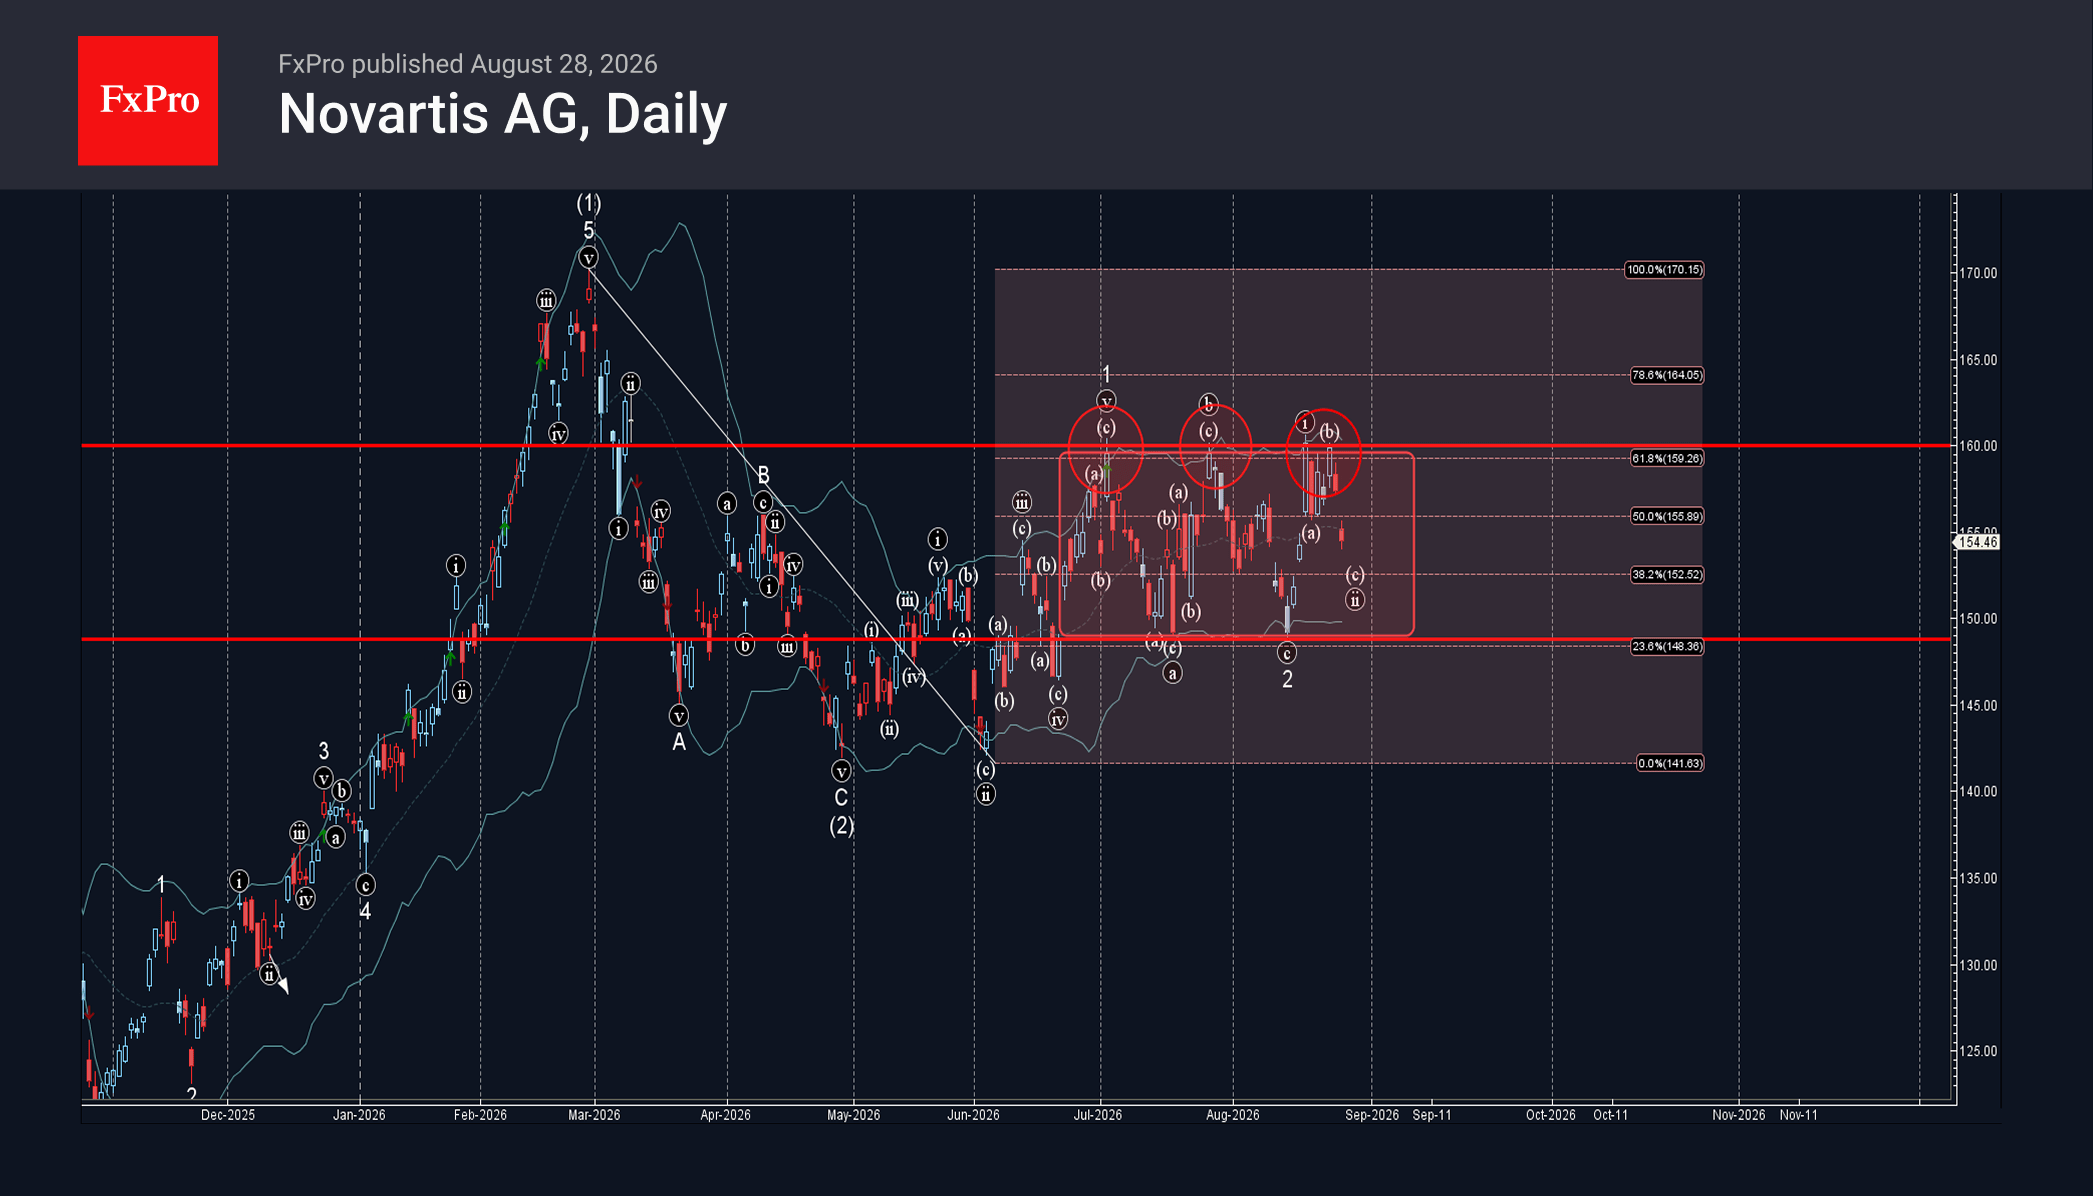
Novartis: ⬇️ Sell
– Novartis reversed from resistance zone
– Likely to fall to support level 148.80
Novartis recently reversed with the downward gap from the resistance zone between the resistance level 160.00 (top of the sideways price range from June) , 61.8% Fibonacci correction of the downward correction from February and the upper daily Bollinger Band.
The downward reversal from this resistance zone started the active short-term ABC correction ii.

Novartis can be expected to fall further to the next support level 148.80 – lower border of the active the sideways price range.