Technical analysis
Natural gas Wave Analysis 21 October, 2020
October 21, 2020 @ 17:48 +03:00

• Natural gas broke resistance area
• Likely to reach 3.100
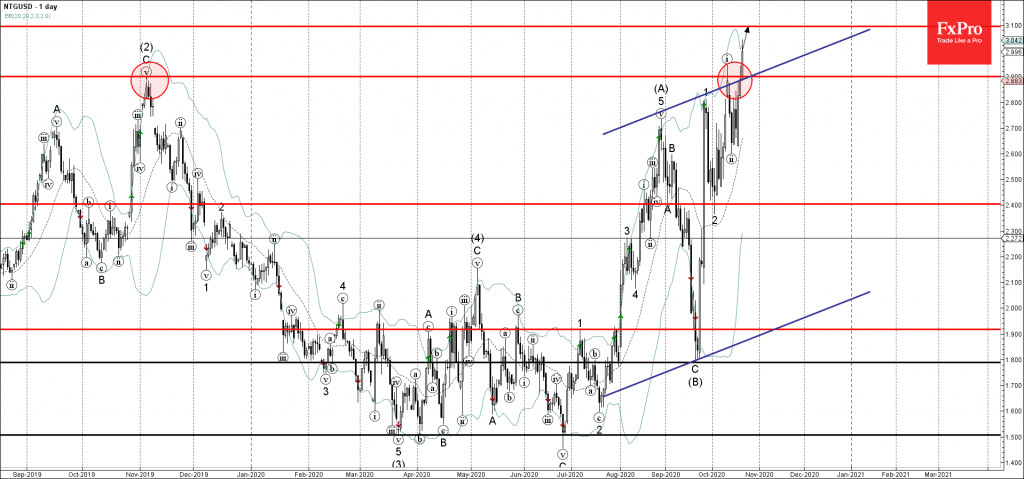
Natural gas recently broke above the resistance area located at the intersection of the multi-month resistance level 2.900 and the resistance trendline of the daily up channel from July.
The breakout of this resistance area continues the active impulse wave (iii) of the sharp upward impulse sequence (C) from September.
Natural gas is likely to rise further toward the next resistance level 3.100 – the breakout of which will lead to further gains toward 3.200.


