Technical analysis
Natural Gas Wave Analysis – 04 March, 2020
March 04, 2020 @ 17:53 +03:00

- Natural Gas reversed from long-term support area
- Likely to rise to 2.00
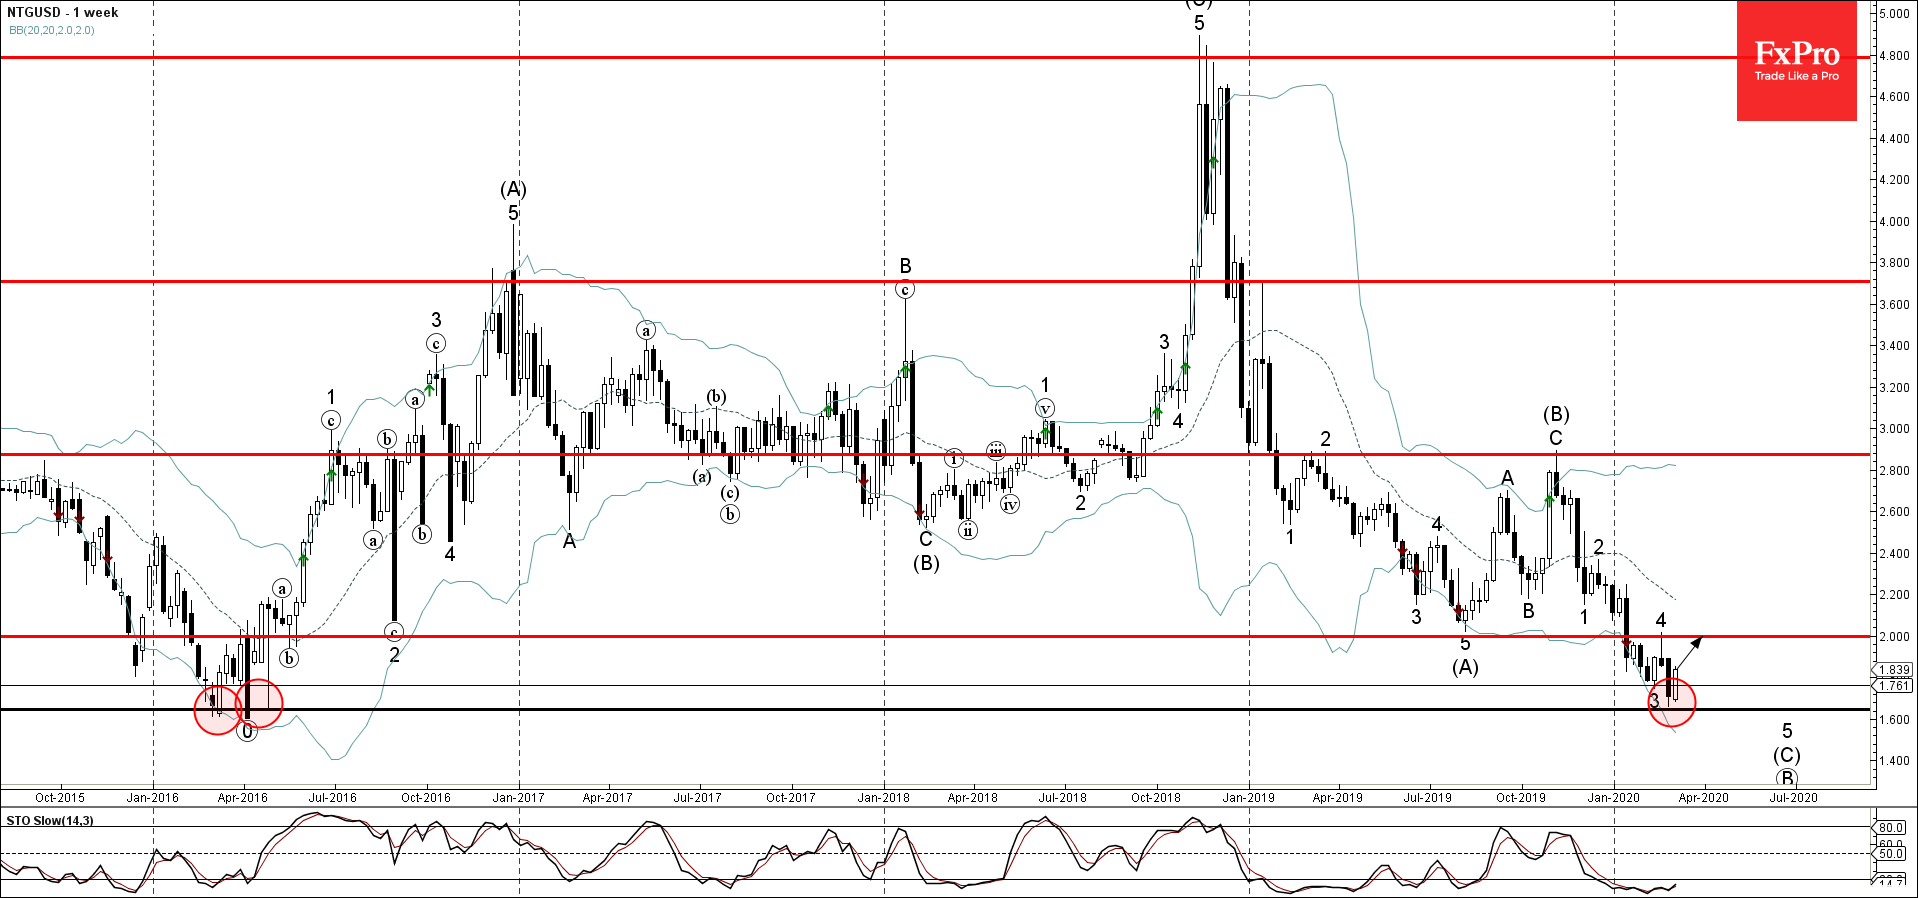
Natural Gas recently reversed up from the long-term support area lying at the intersection of the multi-year support level 1.6440 (which started the sharp weekly uptrend in 2106) and the lower weekly Bollinger Band.
The upward reversal from this support area stopped the previous short-term impulse wave 5.
Given the oversold weekly Stochastic – Natural Gas is likely to rise further toward the next round resistance level 2.00 (former yearly low from 2019 and the top of the previous correction 4).


