Technical analysis
Nasdaq Wave Analysis 10 September 2024
September 10, 2024 @ 23:33 +03:00

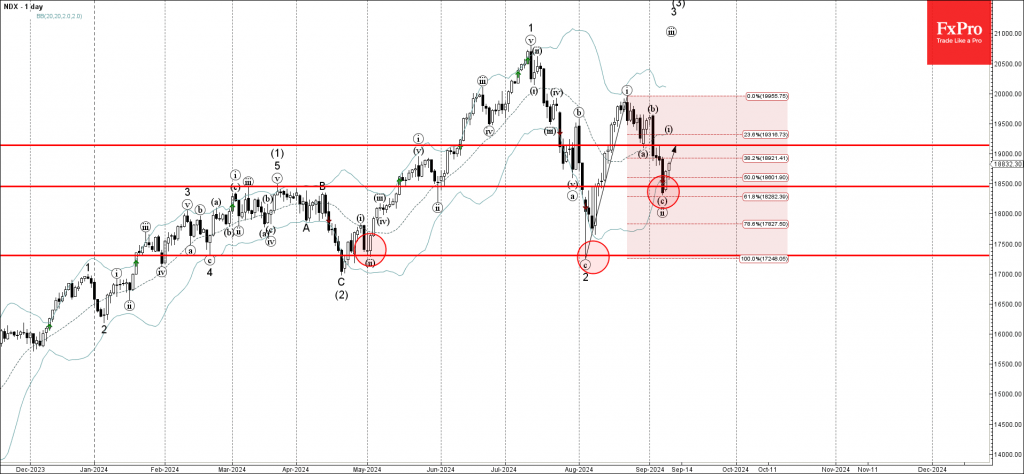
– Nasdaq reversed from support zone
– Likely to rise to resistance level 19135.00
Nasdaq index recently reversed up from the support zone located between the key support level 18500.00, lower daily Bollinger Band and the 61.8% Fibonacci correction of the upward impulse from August.
The upward reversal from this support zone created the daily Japanese candlesticks reversal pattern Piercing Line – which started the active impulse wave iii.
Given the overriding daily uptrend, Nasdaq index can be expected to rise further to the next resistance level 19135.00, former minor support from the end of August.


