


Technical analysis
Nasdaq-100 Wave Analysis – 31 March 2026
March 31, 2026 @ 22:33 +03:00
Nasdaq-100: ⬆️ Buy
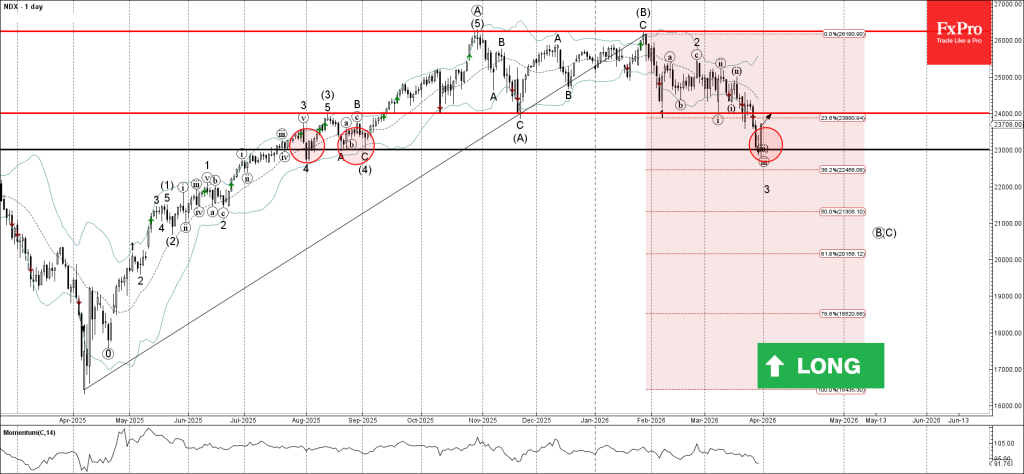
– Nasdaq-100 reversed from support level 23000.00
– Likely to rise to resistance level 24000.00
Nasdaq-100 index recently reversed from the support zone between the long-term support level 23000.00 (which has been reversing the price from August of 2025), lower daily Bollinger Band and the 38.2% Fibonacci correction of the upward impulse from last April.
The upward reversal from this support zone is currently forming the daily Japanese candlesticks reversal pattern Morning Star.

Nasdaq-100 index can be expected to rise to the next resistance level 24000.00 (former multi-month support from last September).