


Technical analysis
IBM Wave Analysis – 6 January 2026
January 07, 2026 @ 00:13 +03:00
IBM: ⬆️ Buy
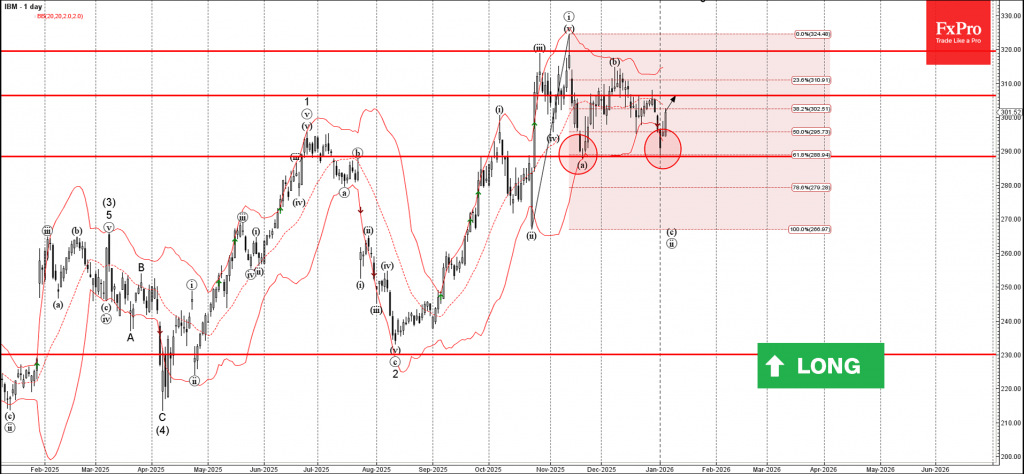
– IBM reversed from support zone
– Likely to rise to resistance level 305.00
IBM recently reversed up from the support zone between the key support level 290.00 (low of wave a from November), lower daily Bollinger Band and the 61.8% Fibonacci correction of the upward impulse from October.
The upward reversal from this support zone stopped the c-wave of the previous ABC correction ii.

Given the strong daily uptrend, IBM can be expected to rise to the next resistance level 305,00 (which reversed the price in December).