


Technical analysis
Halliburton Wave Analysis – 25 August 2026
August 25, 2026 @ 21:48 +03:00
Halliburton: ⬇️ Sell
– Halliburton reversed from resistance level 36.00
– Likely to fall to support level 33.00
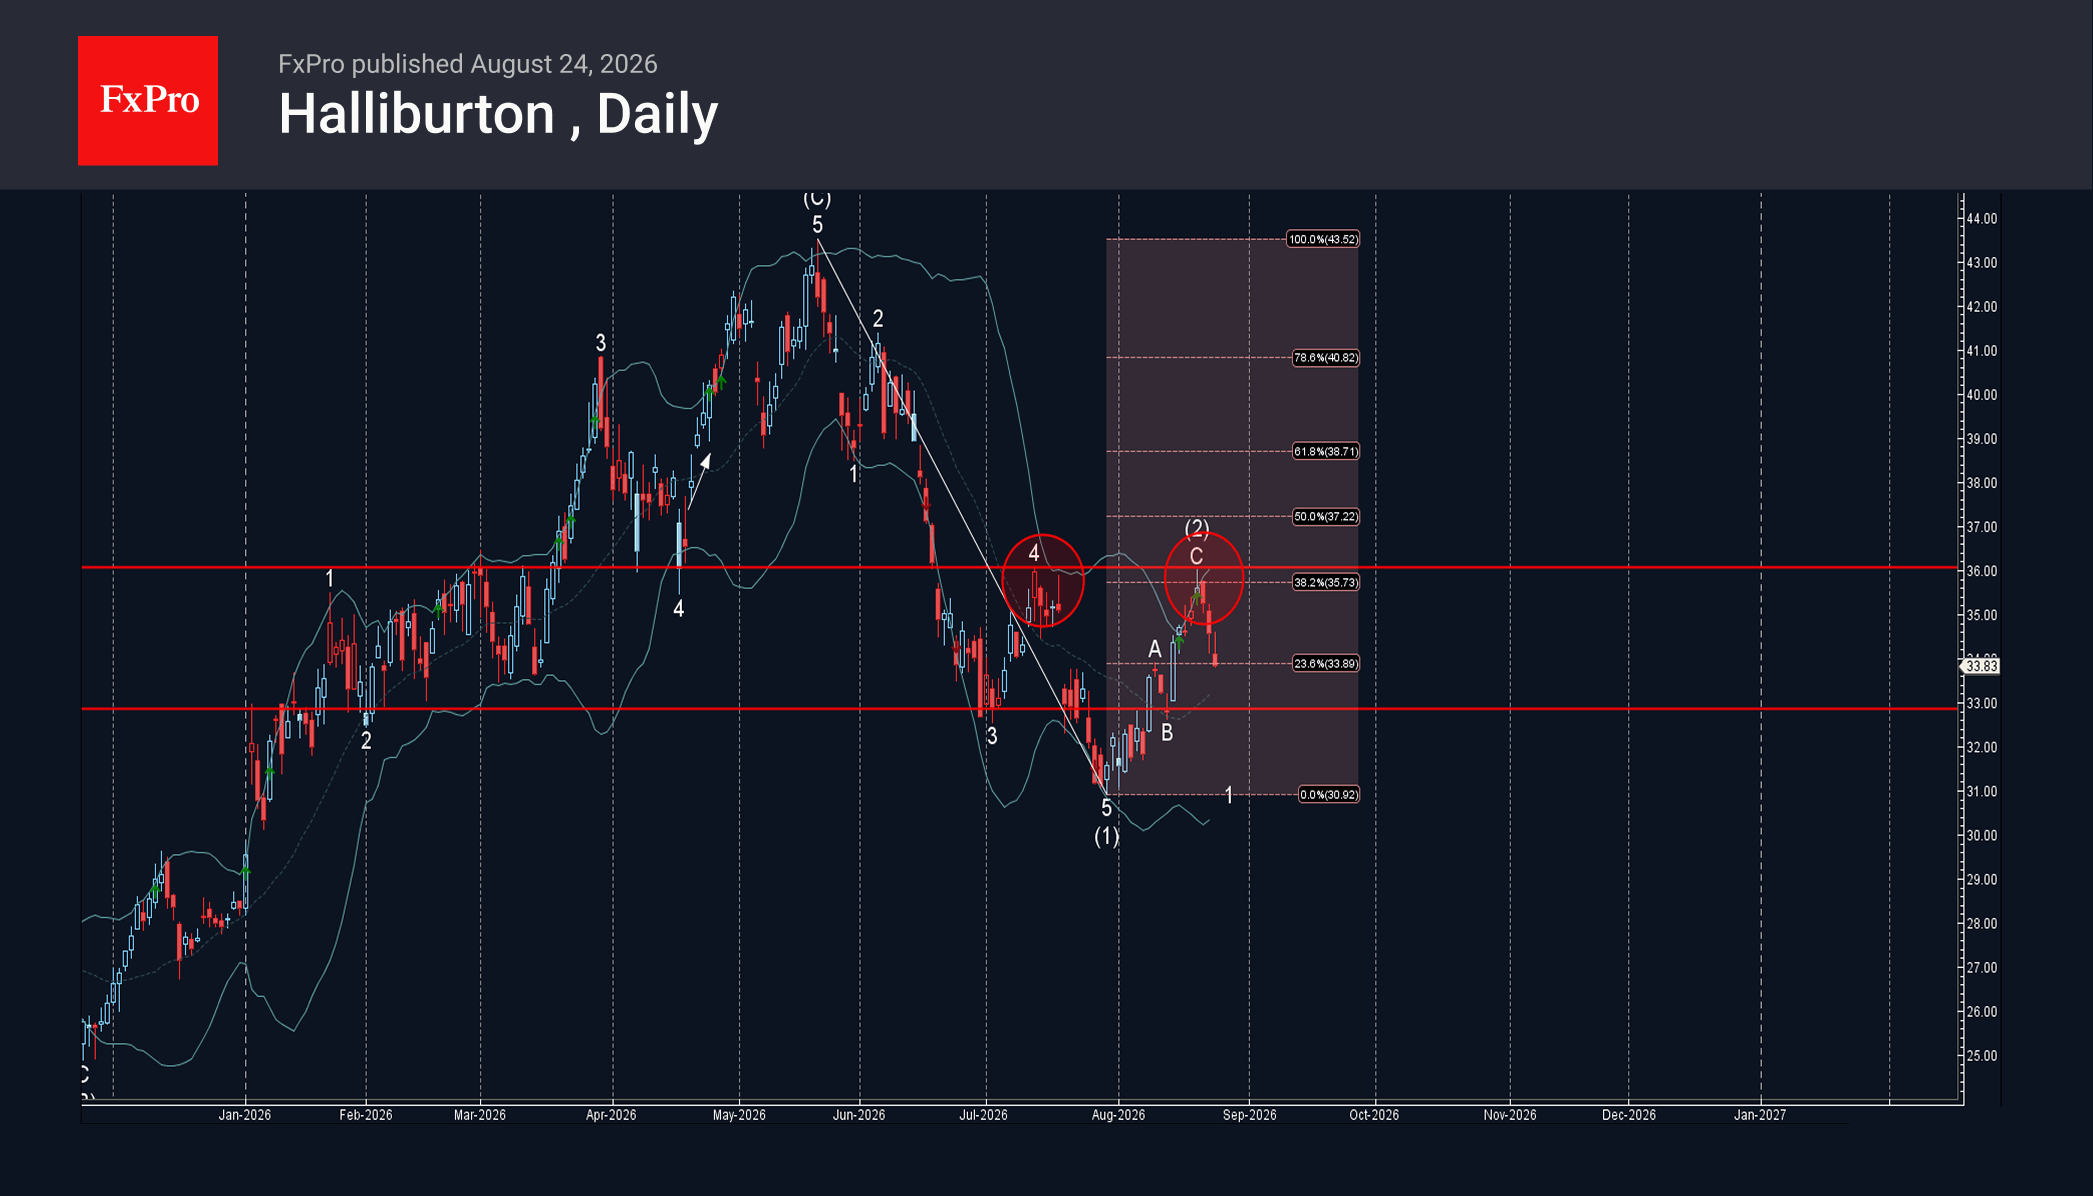
Halliburton recently reversed down from the resistance level 36.00 (top of wave from July), intersecting with the upper daily Bollinger Band and the 38.2% Fibonacci correction of the downward impulse from May.
The downward reversal from the from the resistance level 36.00 started the active impulse wave (3).

Halliburton can be expected to fall further to the next support level 33.00 – low of the previous minor correction B.