Technical analysis
Gold Wave Analysis 31 March, 2021
March 31, 2021 @ 17:51 +03:00

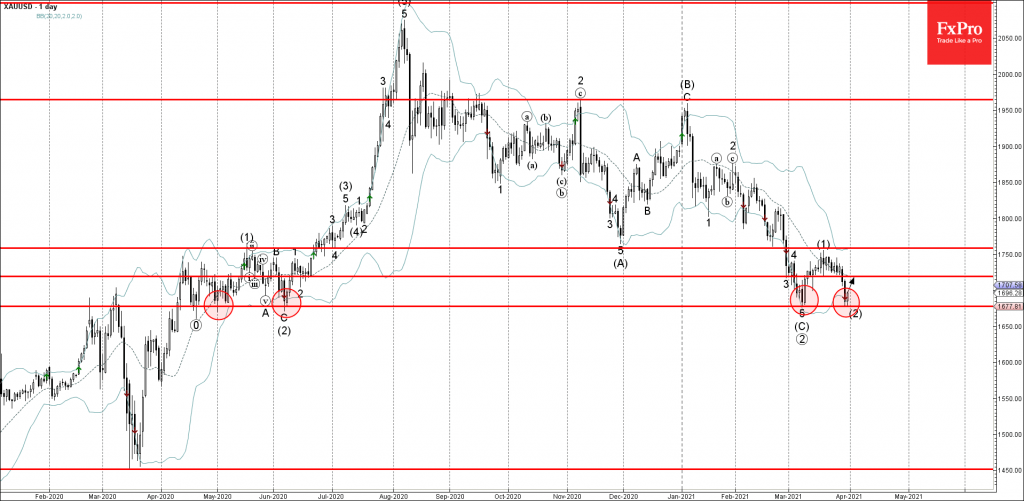
• Gold reversed from key support level 1680.00
• Likely to reach resistance level 1720.00
Gold recently reversed up from the key long-term support level 1680.00, which has been reversing the price from the middle of April of 2020 – as can be seen from the daily Gold chart below.
The support area near the support level 1680.00 was further strengthened by the lower daily Bollinger Band.
Given the strength of the support level 1680.00 – Gold is likely to rise further toward the next resistance level 1720.00 (former minor support from the middle of this month).


