Technical analysis
Gold Wave Analysis – 30 January, 2019
January 30, 2019 @ 10:27 +03:00

- Gold broke resistance area
- Further gains are likely
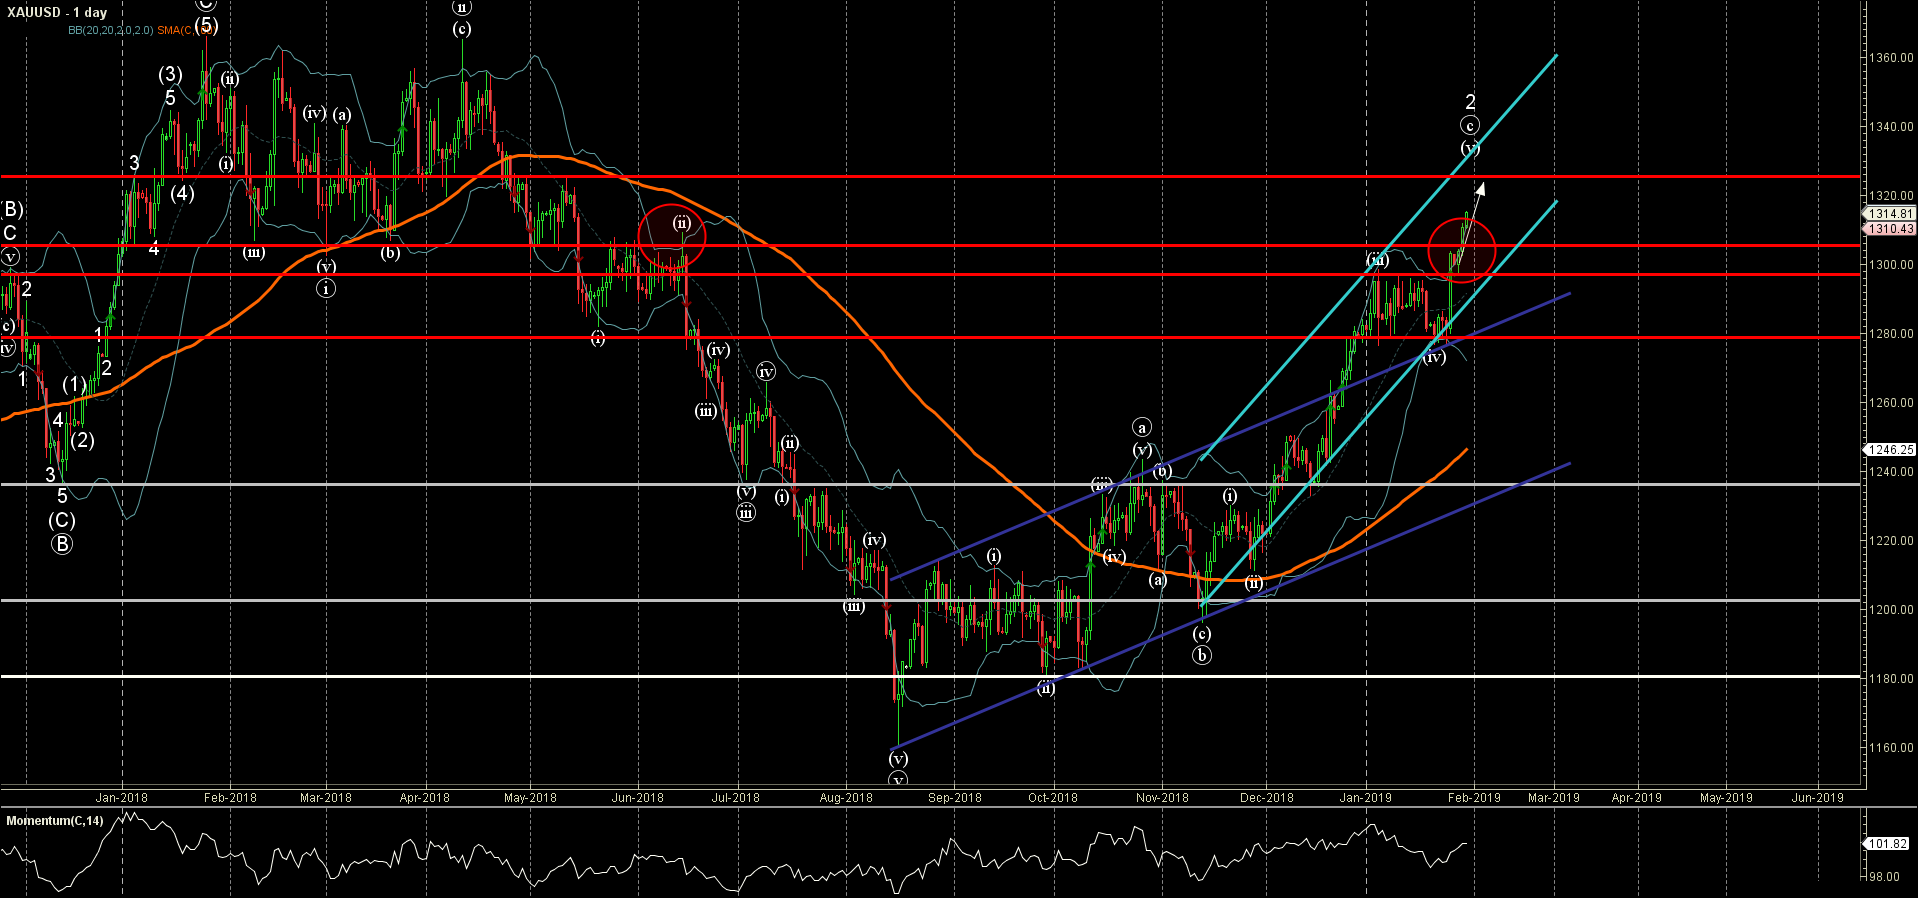
Gold recently broke the resistance area lying between the resistance levels 1300.00 (which has been reversing the price from the start of January) and 1305.00 (previous monthly high from June).
The breakout of this resistance zone accelerated the active short-term impulse wave (c) – which belongs to wave 2 from the middle of August.
With the rising daily Momentum – Gold is expected to rise further and re-test the next resistance level 1320.00 (intersecting with the resistance trendline of the accelerated daily up channel from November).


