Technical analysis
Gold Wave Analysis – 26 October , 2018
October 26, 2018 @ 19:17 +03:00
- Gold broke resistance area
- Further gains are likely
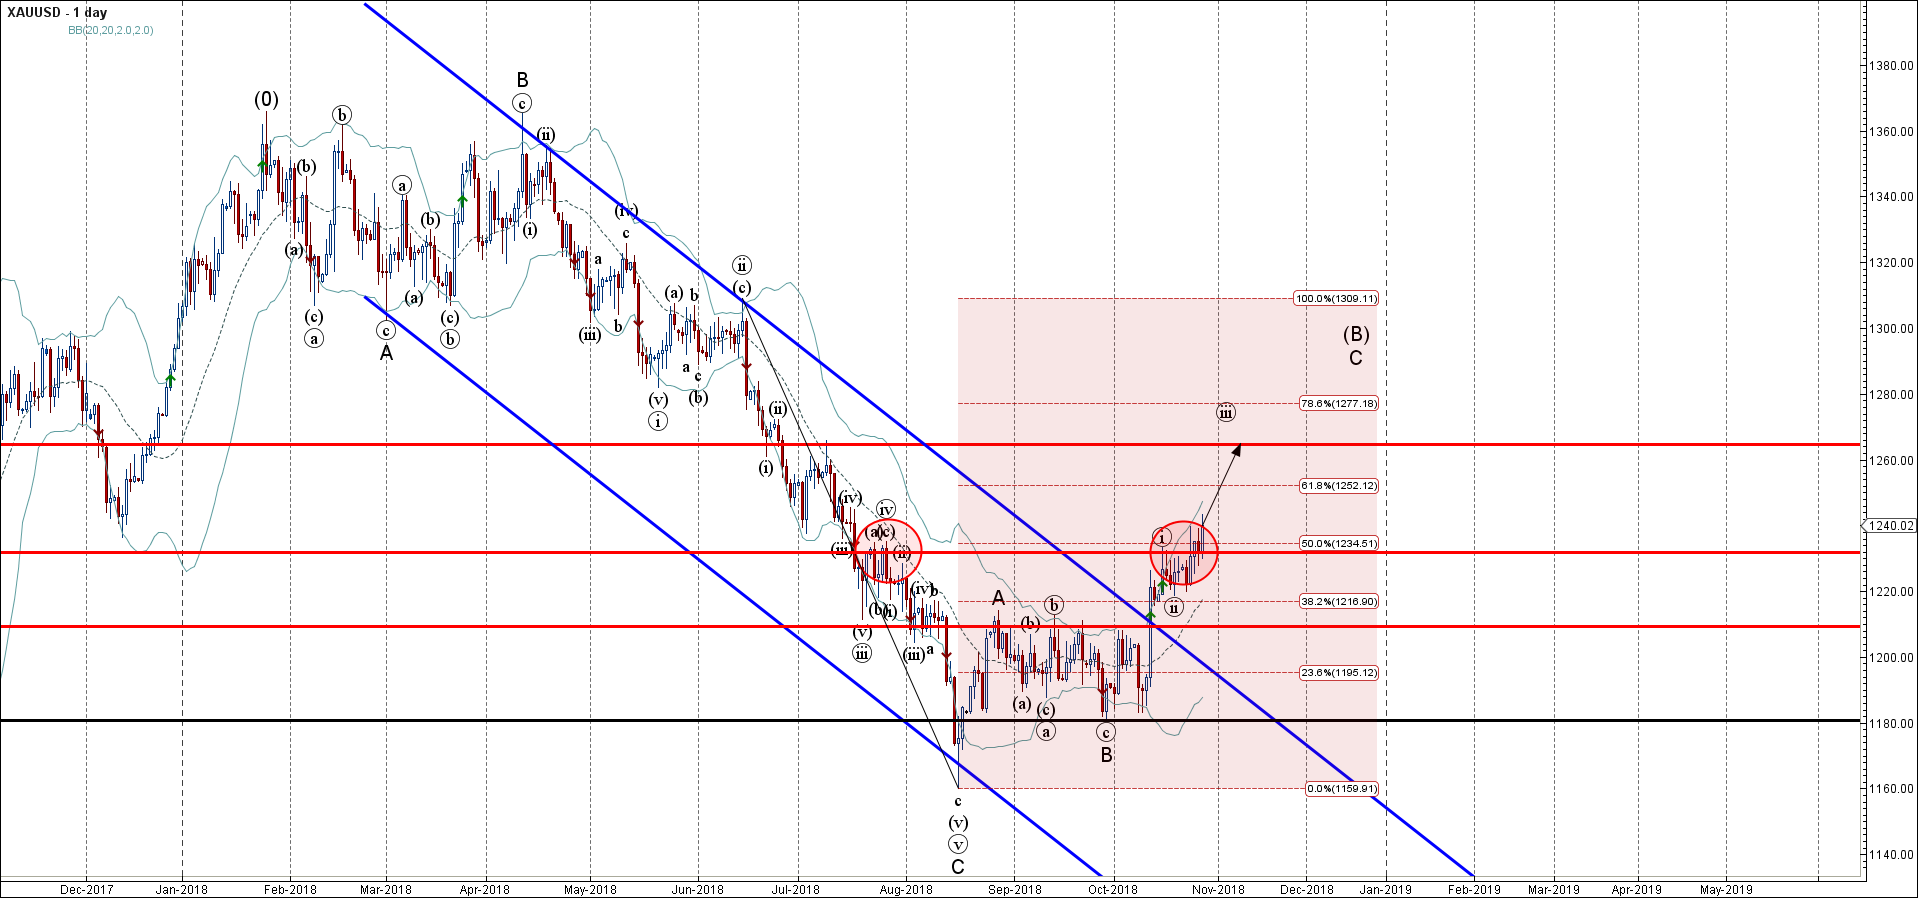
Gold continues to rise after the earlier breakout of the resistance area lying at the intersection of the strong resistance level 1230.00 (which reversed the price twice in July) and the 50% Fibonacci correction of the previous sharp downward impulse from June.
The breakout of this resistance area accelerated the active short-term impulse wave C – which belongs to the medium-term ABC correction (B) from August.
Gold is expected to rise further and re-test the next strong resistance level 1265.00 (monthly high from July).


