Technical analysis
Gold Wave Analysis 19 July 2024
July 19, 2024 @ 23:56 +03:00

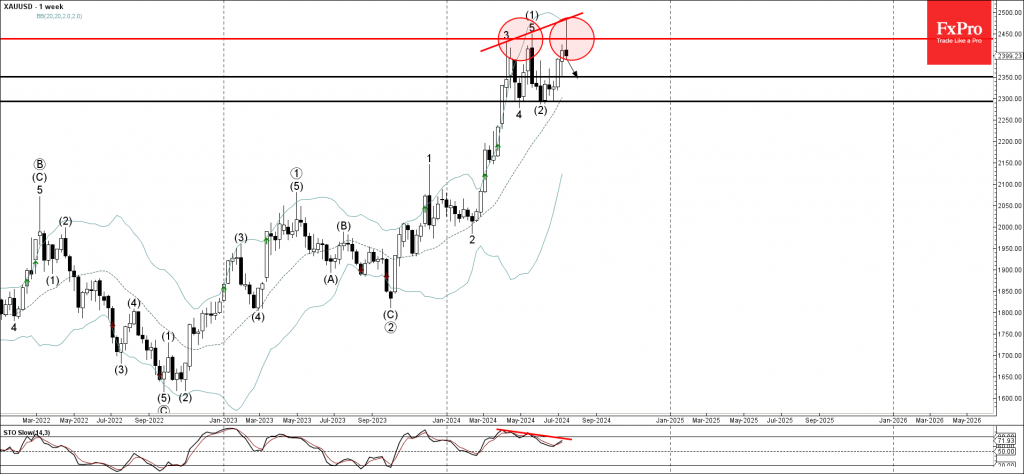
– Gold reversed from resistance area
– Likely to fall to support level 2350.00
Gold recently reversed down from the resistance area located between the pivotal resistance level 2440.00 (which stopped the previous waves 3 and 5, as can be seen below) and the upper weekly Bollinger Band.
The downward reversal from this resistance area is likely to form the weekly Japanese candlesticks reversal pattern Shooting Star Doji – strong sell signal for gold.
Given the clear triple bearish divergence on the weekly Stochastic indicator, Gold can be expected to fall further to the next support level 2350.00.


