Technical analysis
Gold Wave Analysis – 17 April, 2020
April 17, 2020 @ 17:51 +03:00

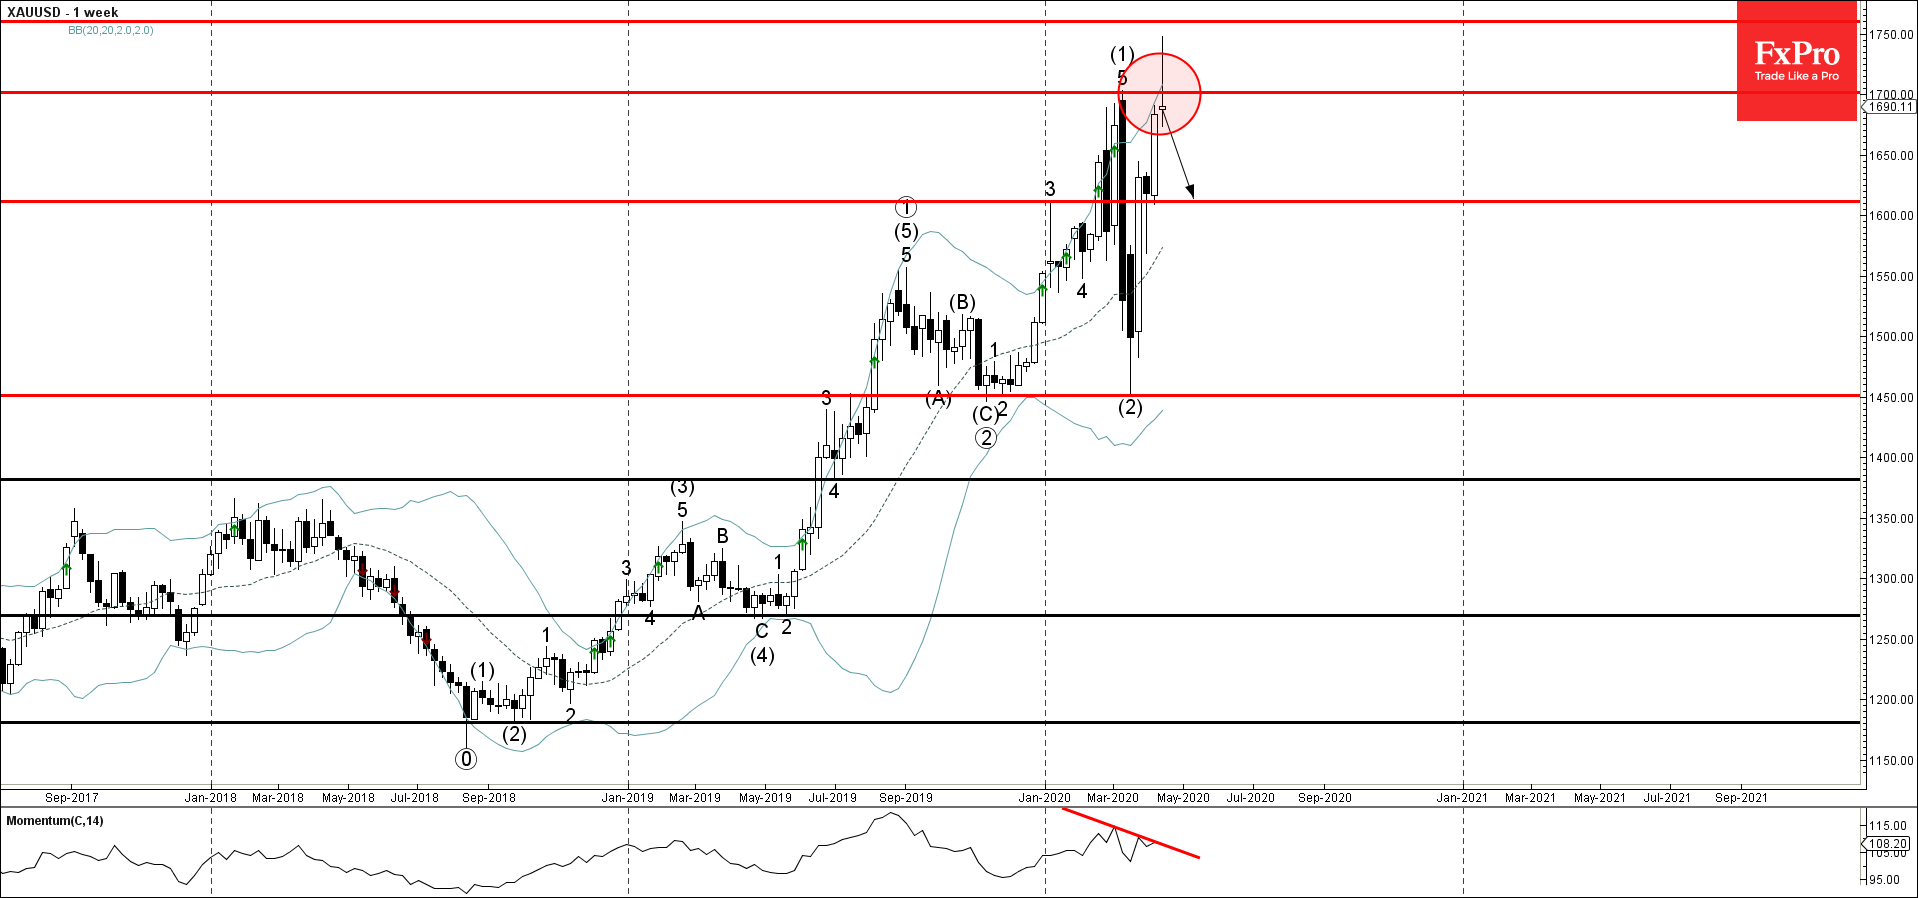
- Gold reversed from resistance zone
- Likely to fall to 1600.00
Gold recently reversed down sharply from the resistance area located between the resistance level 1700.00 (which stopped the previous impulse wave (1)) and the upper weekly Bollinger Band.
The downward reversal from this resistance zone is likely to create the weekly Japanese candlesticks reversal pattern Shooting Star Doji – if Gold closes the week near the current levels.
Given the clear bearish divergence on the weekly RSI indicator – Gold is expected to fall further toward the next round support level 1600.00.


