


Technical analysis
General Electric Wave Analysis 22 July 2024
July 22, 2024 @ 23:44 +03:00
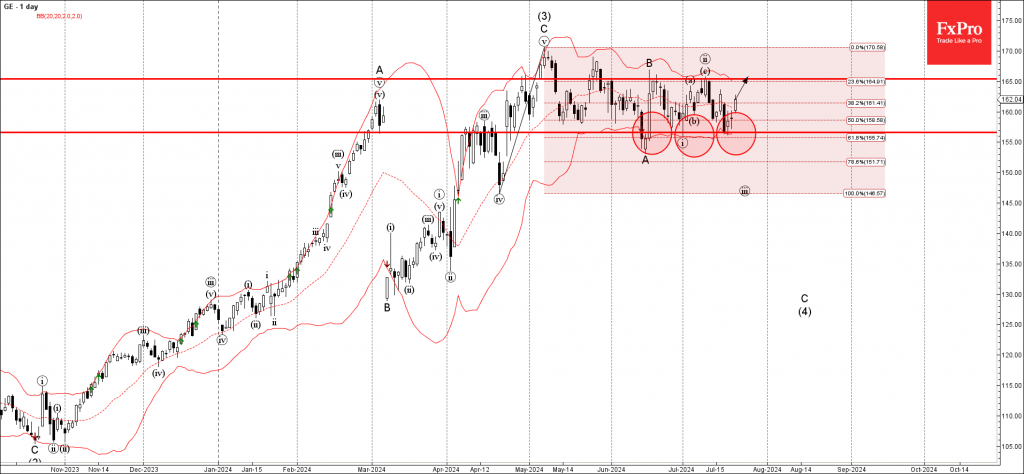
– General Electric reversed from support area
– Likely to rise to resistance level 165.00
General Electric earlier reversed up from the support area located between the key support level 156.55 (which reversed the price multiple times from June), lower daily Bollinger Band and the 61.8% Fibonacci correction of the previous upward impulse from April.
The upward reversal from this support area created the daily Japanese candlesticks reversal pattern Doji, highlighting the strength of this support area.
Given the prevailing uptrend, General Electric can be expected to rise further to the next resistance level 165.00 (which stopped the earlier waves B, a and c).
