Technical analysis
GBPCAD Wave Analysis – 18 November, 2019
November 18, 2019 @ 17:21 +03:00

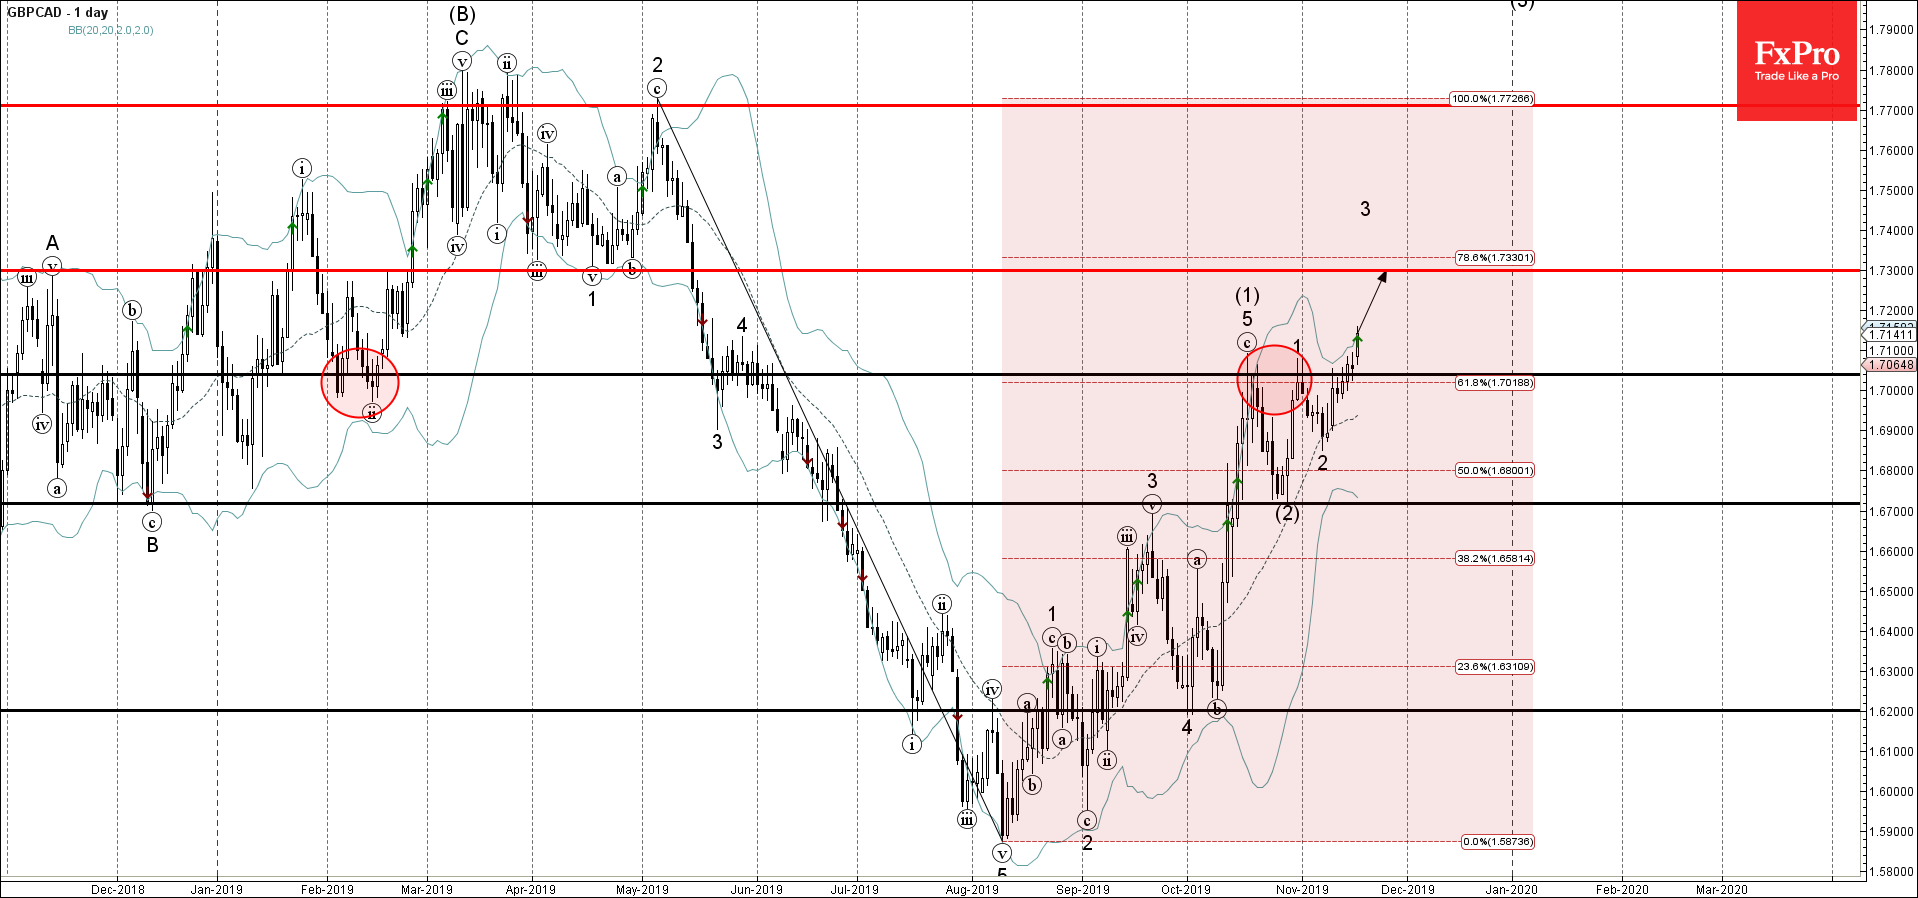
- GBPCAD broke resistance area
- Likely to rise to 1.7300
GBPCAD recently broke the resistance area lying between the resistance level 1.7040 (which reversed the price twice in October) and the 61.8% Fibonacci correction of the previous downward impulse from May.
The breakout of this resistance area should accelerate the active impulse waves 3 and (3).
GBPCAD is expected to rise further toward the next resistance level 1.7300 (former strong support from April).


