Technical analysis
GBPCAD Wave Analysis – 16 April, 2020
April 16, 2020 @ 17:36 +03:00

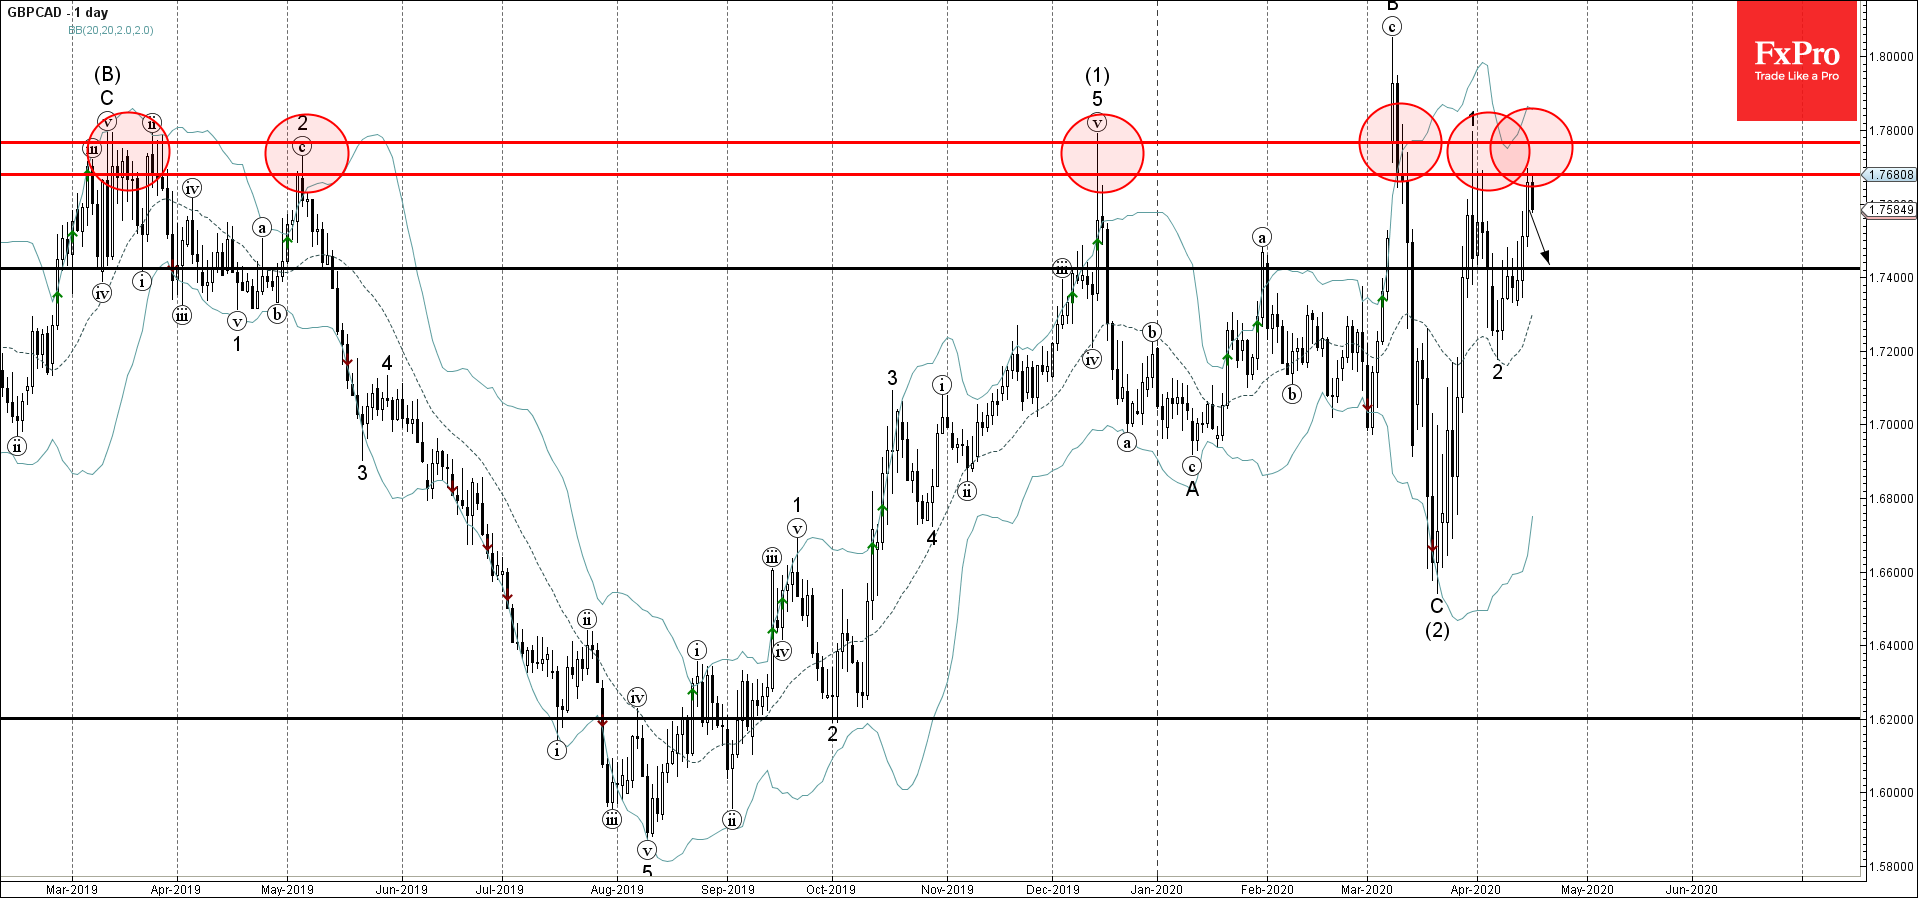
- GBPCAD reversed from resistance area
- Likely to fall to 1.7400
GBPCAD recently reversed down from the resistance area lying between the resistance levels 1.7800 (top of the earlier impulse 1), 1.7680 and the upper daily Bollinger Band.
The downward reversal from this resistance area stopped the previous short-term impulse wave 3.
Given the strength of the aforementioned resistance area – GBPCAD is likely to fall further toward the next support level 1.7400.