Technical analysis
GBPCAD Wave Analysis – 10 June, 2019
June 10, 2019 @ 15:13 +03:00

- GBPCAD broke support area
- Further losses are likely
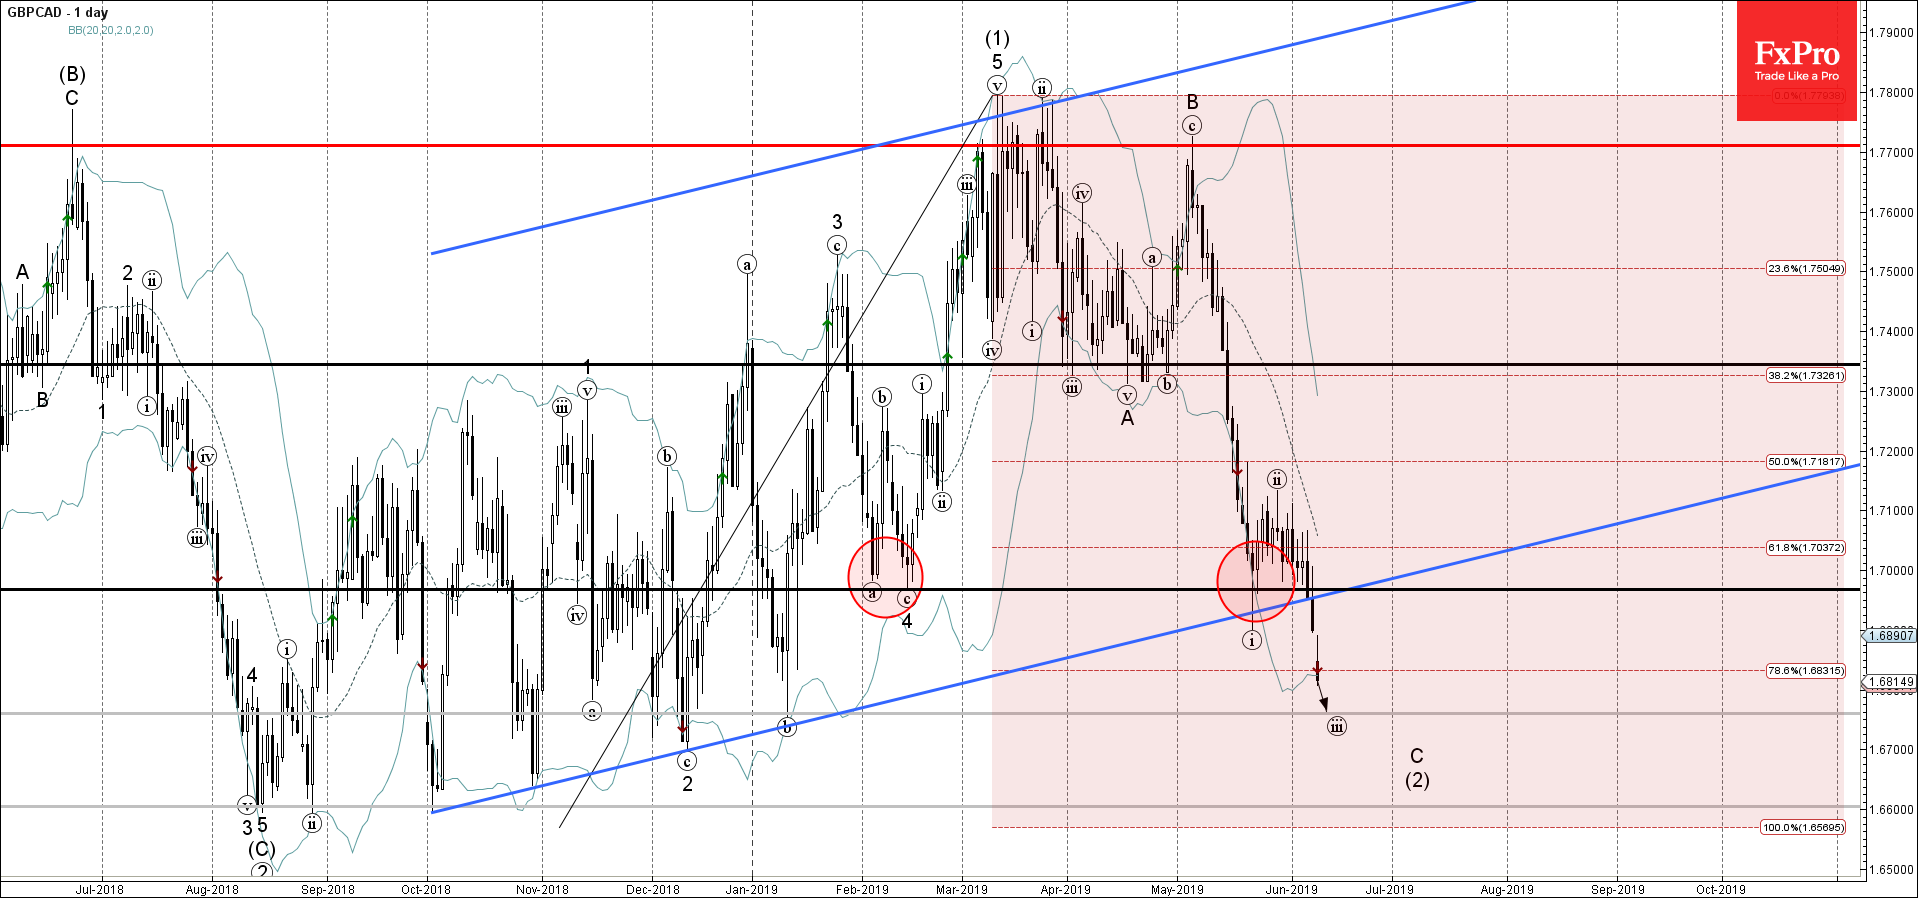
GBPCAD recently broke sharply through the support area lying between the key support level 1.6970 (former monthly low from February – which created daily Hammer in May) and the support trendline of the daily up channel from last October.
The breakout of this support area accelerated the active impulse wave C – which belongs to the ABC correction (2) from March.
GBPCAD is expected to fall further and retest the next pivotal support level 1.6760 (monthly low from the start of January).


