Technical analysis
Ford Wave Analysis 31 January 2024
January 31, 2024 @ 23:14 +03:00

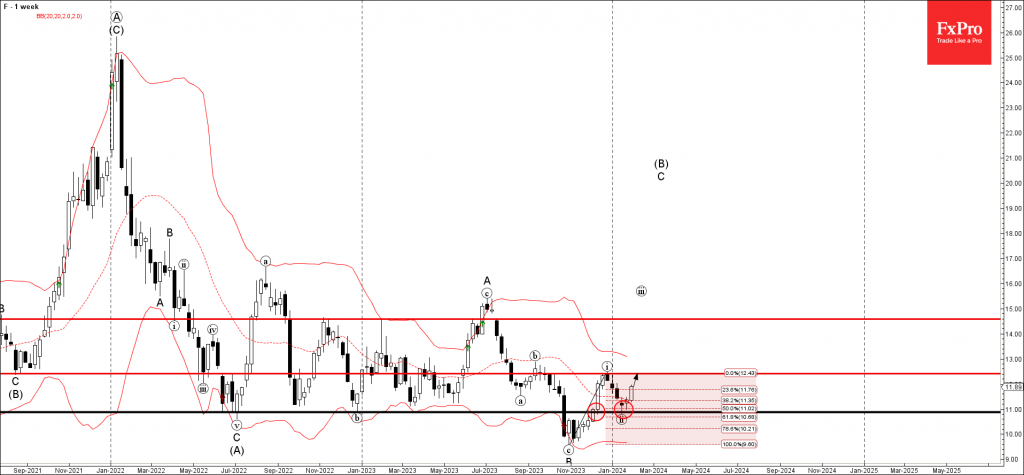
– Ford reversed from support level 11.00
– Likely to rise to resistance level 12.40
Ford recently reversed up from the key support level 11.00, which has been repeatedly reversing the price from the middle of 2022, as can be seen from the weekly Ford chart below.
The support level 11.00 was strengthened by the 20-week moving average and by the 50% Fibonacci correction of the upward impulse from last year.
Given the strength of the support level 11.00, Ford can be expected to rise further to the next resistance level 12.40 (top of the previous impulse wave i).


