Technical analysis
Exxon Wave Analysis – 15 October, 2019
October 15, 2019 @ 16:51 +03:00
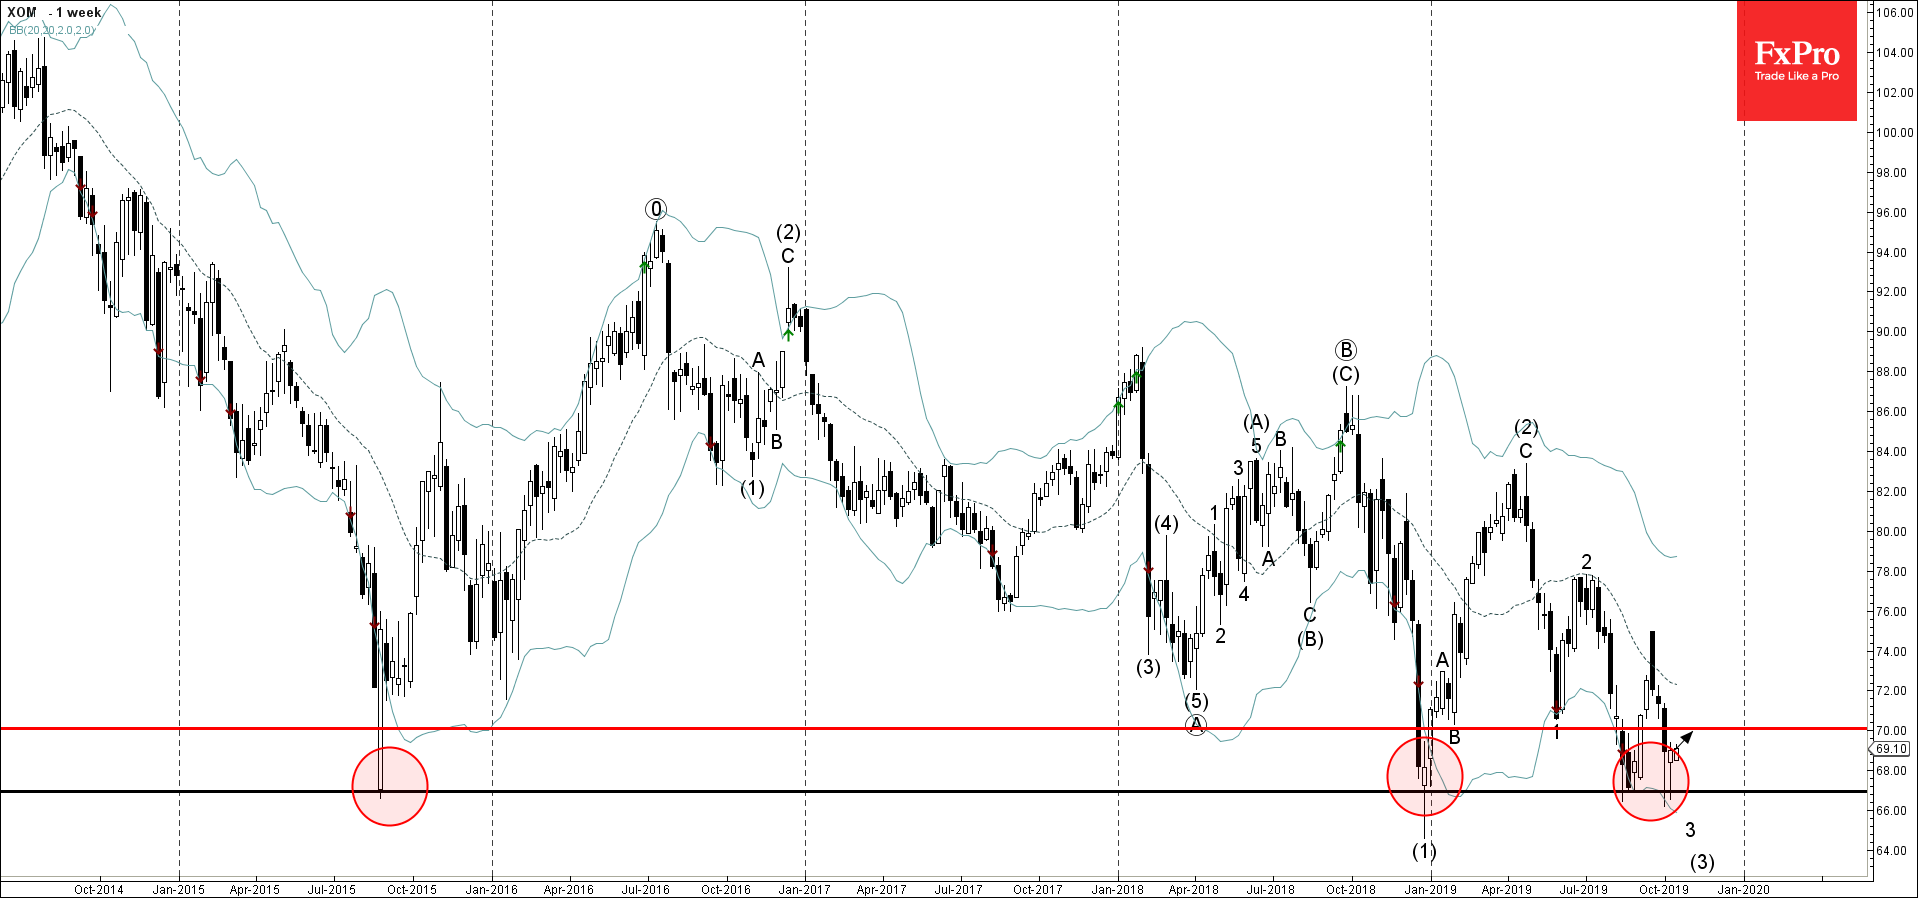
- Exxon reversed from long-term support level 66.90
- Likely to rise to 70.00
Exxon recently reversed up sharply from the support area lying between the long-term support level 66.90 (which has been reversing the price from 2015) and the lower weekly Bollinger Band.
The upward reversal from this support area created the weekly reversal pattern Hammer.
Given the strength of the aforementioned support area Exxon is expected to rise further and retest the next round resistance level 70.00.