Technical analysis
Exxon Mobil Wave Analysis 5 February, 2021
February 05, 2021 @ 18:49 +03:00
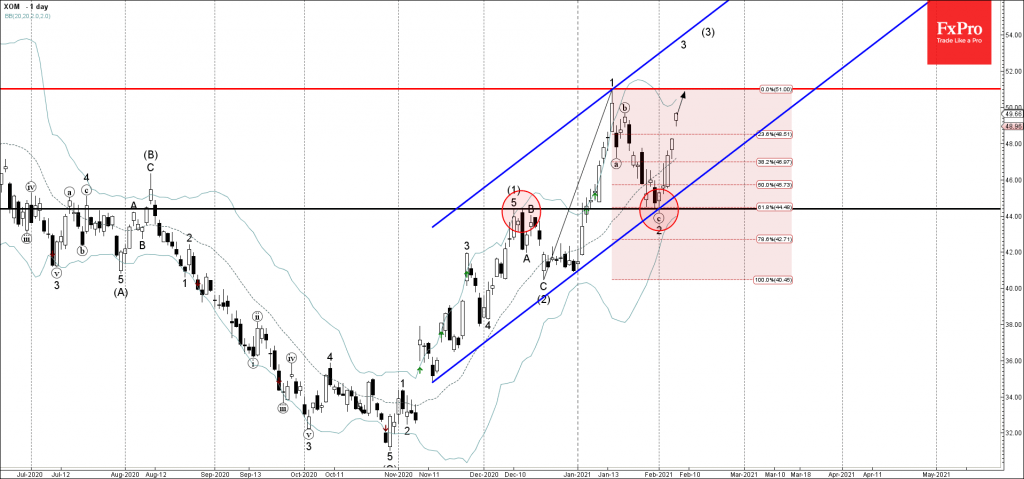
• Exxon Mobil rising inside impulse wave 3
• Likely to reach resistance level 51.00
Exxon Mobil continues to rise inside the sharp upward impulse wave 3 – which started earlier from the pivotal support level 630.00 (former monthly high from December) coinciding with the lower daily Bollinger Band and the 61.8% Fibonacci retracement of the previous upward impulse 1 from December
The active impulse wave 3 belongs to the longer-term impulse sequence (3) from December.
Exxon Mobil is expected to rise further toward the next resistance level 51.00 (top of the previous impulse wave 1).