


Technical analysis
Exxon Mobil Wave Analysis – 16 April 2026
April 17, 2026 @ 00:17 +03:00
Exxon Mobil: ⬆️ Buy
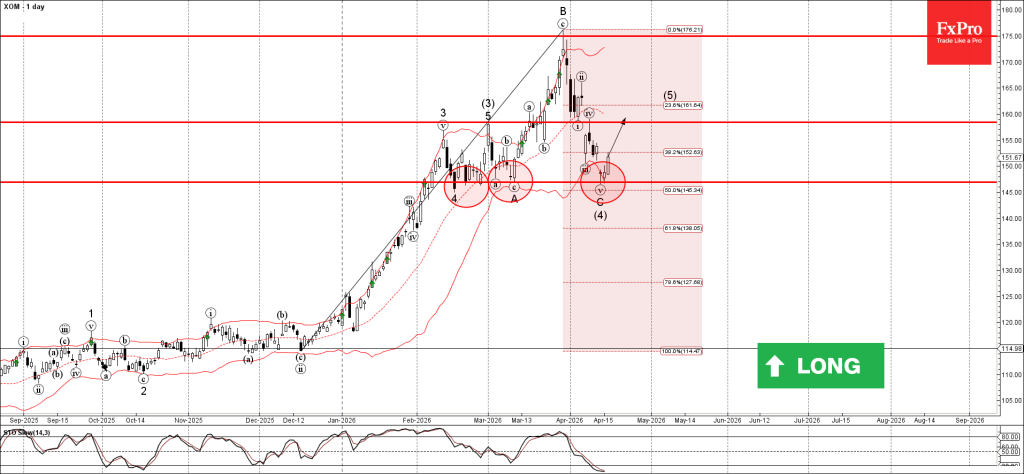
– Exxon Mobil reversed from support zone
– Likely to rise to resistance level 158.50.
Exxon Mobil recently reversed up from the support zone between the support level 146.90 (which has been reversing the price from February), 50% Fibonacci correction of the upward impulse from December and the lower daily Bollinger Band.
The upward reversal from the support level 146.90 started the active medium-term impulse wave (5).

Given the clear daily uptrend and the oversold daily Stochastic, Exxon Mobil can be expected to rise toward the next resistance level 158.50.