Technical analysis
Exxon Mobil Wave Analysis 15 October 2024
October 15, 2024 @ 23:58 +03:00

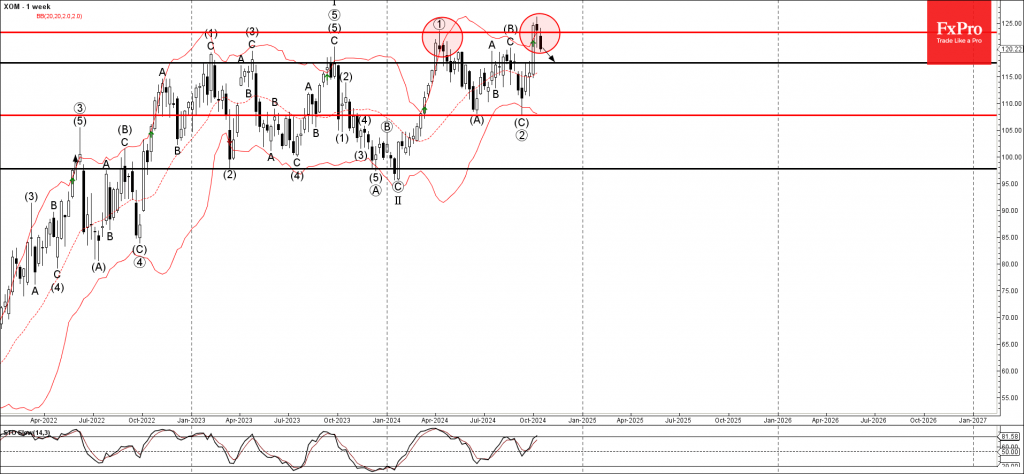
– Exxon Mobil reversed from the resistance zone
– Likely to fall to support level 117.55
Exxon Mobil recently reversed from the resistance zone between the pivotal resistance level 123.25 (former monthly high from April) and the upper weekly Bollinger Band.
The downward reversal from this resistance zone created the weekly Japanese candlesticks reversal pattern long-legged Doji.
Given the strength of the resistance level 123.25 and the overbought daily Stochastic, Exxon Mobil can be expected to fall further to the next support level 117.55 (former resistance from September).


