Technical analysis
Cotton Wave Analysis 30 October, 2020
October 30, 2020 @ 18:29 +03:00

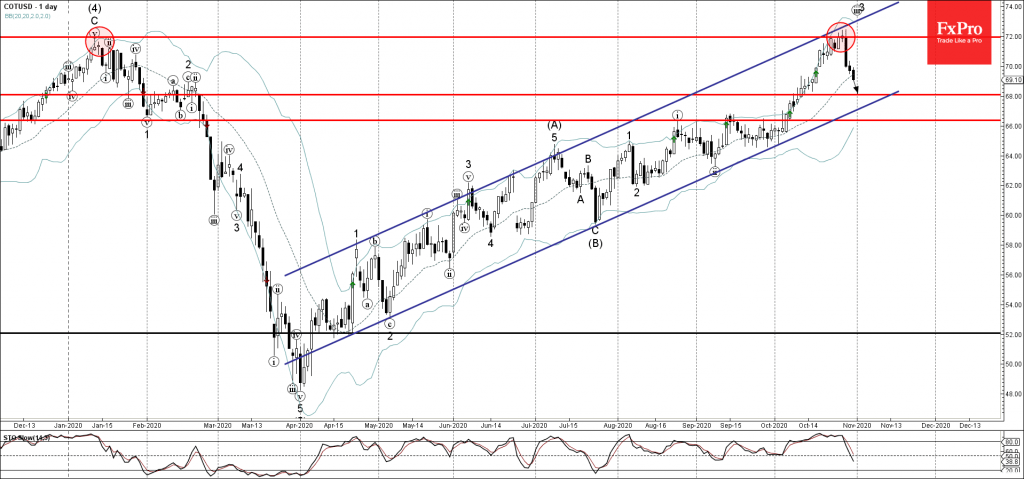
• Cotton reversed from resistance area
• Likely to fall to 68.00
Cotton continues to fall strongly after the earlier downward reversal from the major resistance zone located between themulti-month resistance level 72.00 (which started the strong downtrend in January), upper daily Bollinger Band and the resistance trendline of the daily up channel from April.
The downward reversal from this resistance zone created the daily Japanese candlesticks reversal pattern Evening Star Doji.
Cotton is likely to fall further toward the next support level 68.00 (former resistance level from February).


