Technical analysis
Corn Wave Analysis – 22 April, 2020
April 22, 2020 @ 16:42 +03:00

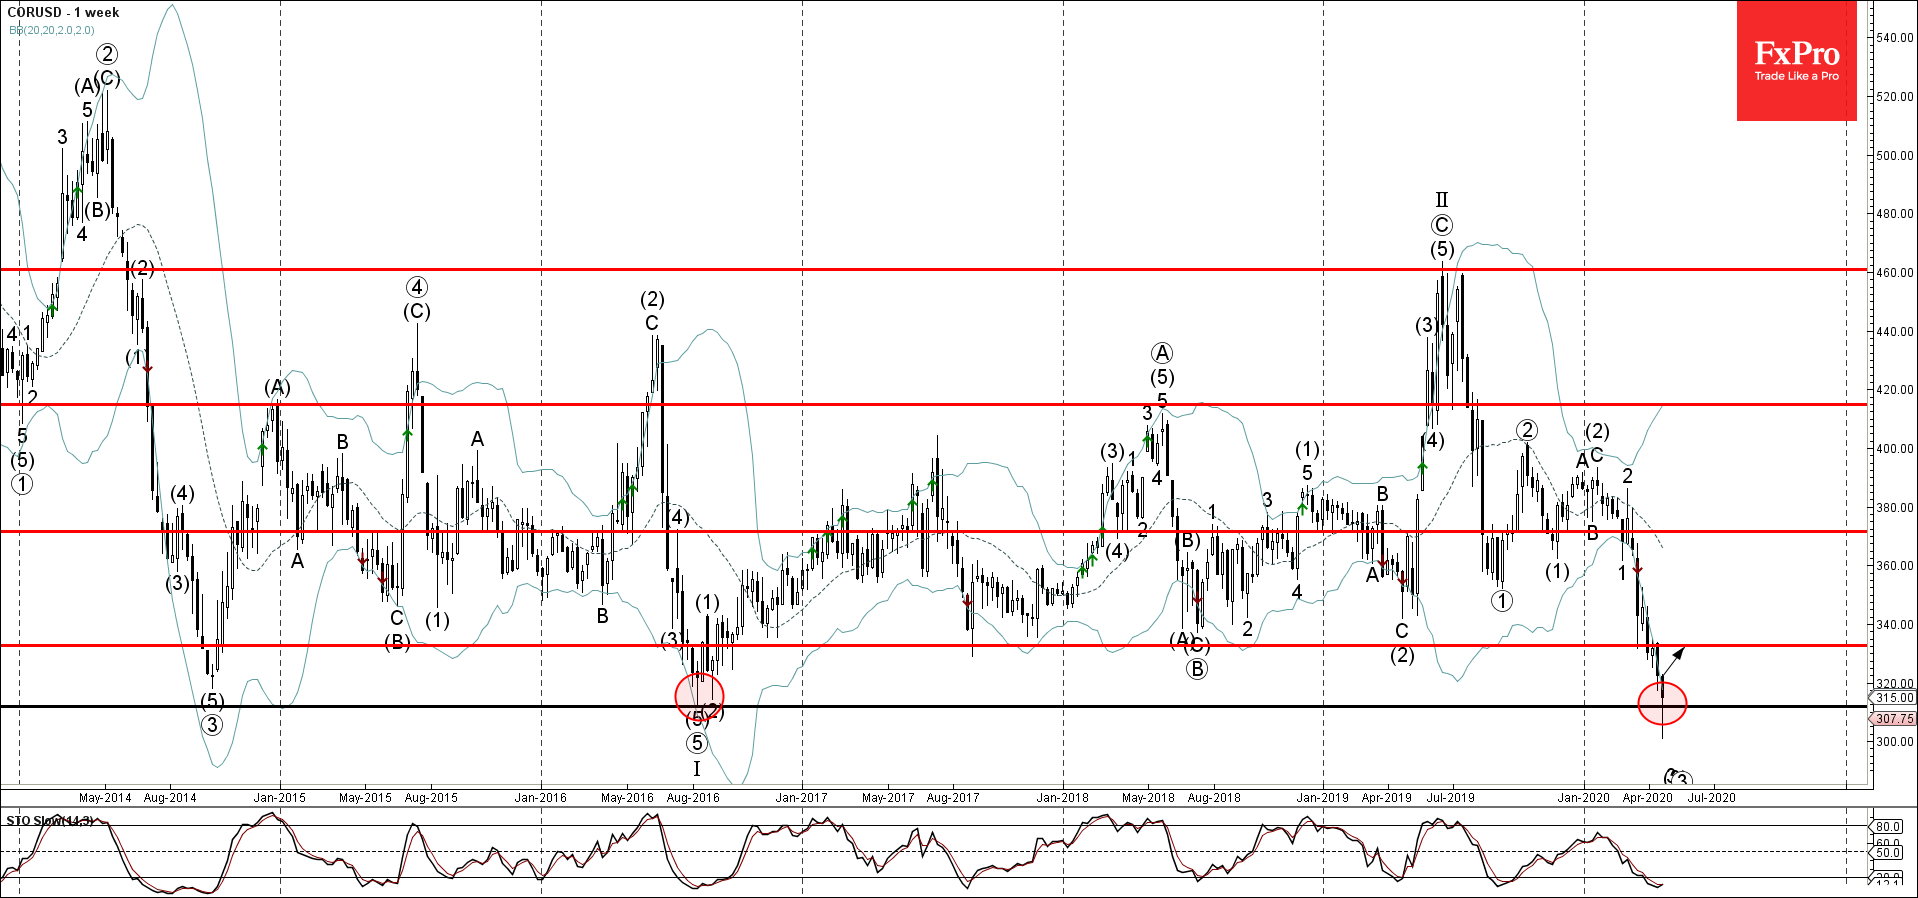
- Corn reversed from long-term support level 305.00
- Likely to rise to 330.00
Corn recently reversed up from the support zone lying between the long-term support level 305.00 (which also reversed the price in the middle of 2016, as can be seen from the weekly Corn chart below) and the lower weekly Bollinger Band.
The upward reversal from this support area stopped the previous multi-week downward impulse sequence (3).
Given the oversold daily Stochastic indicator – Corn is expected to rise further toward the next resistance level 330.00.


