Technical analysis
Copper Wave Analysis – 27 September , 2018
September 27, 2018 @ 19:35 +03:00
- Copper reversed from resistance area
- Copper losses are likely
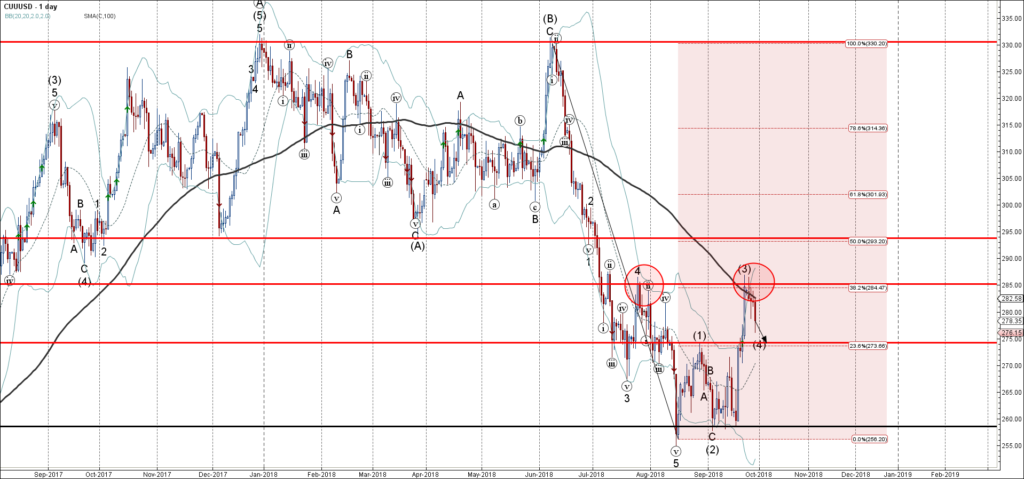
Copper recently reversed down from the resistance area lying between the resistance level 285.00 (top of wave 4 from July), upper daily Bollinger Band, 100-day moving average and the 38.2% Fibonacci correction of the previous downer impulse from June.
The downward reversal from this resistance area started the active short-term corrective wave (4).
Copper is expected fall further and retest the next support level 275.00 (forecast price for the completion of the active correction (4).


