


Technical analysis
Comcast Wave Analysis – 6 July 2026
July 06, 2026 @ 18:30 +03:00
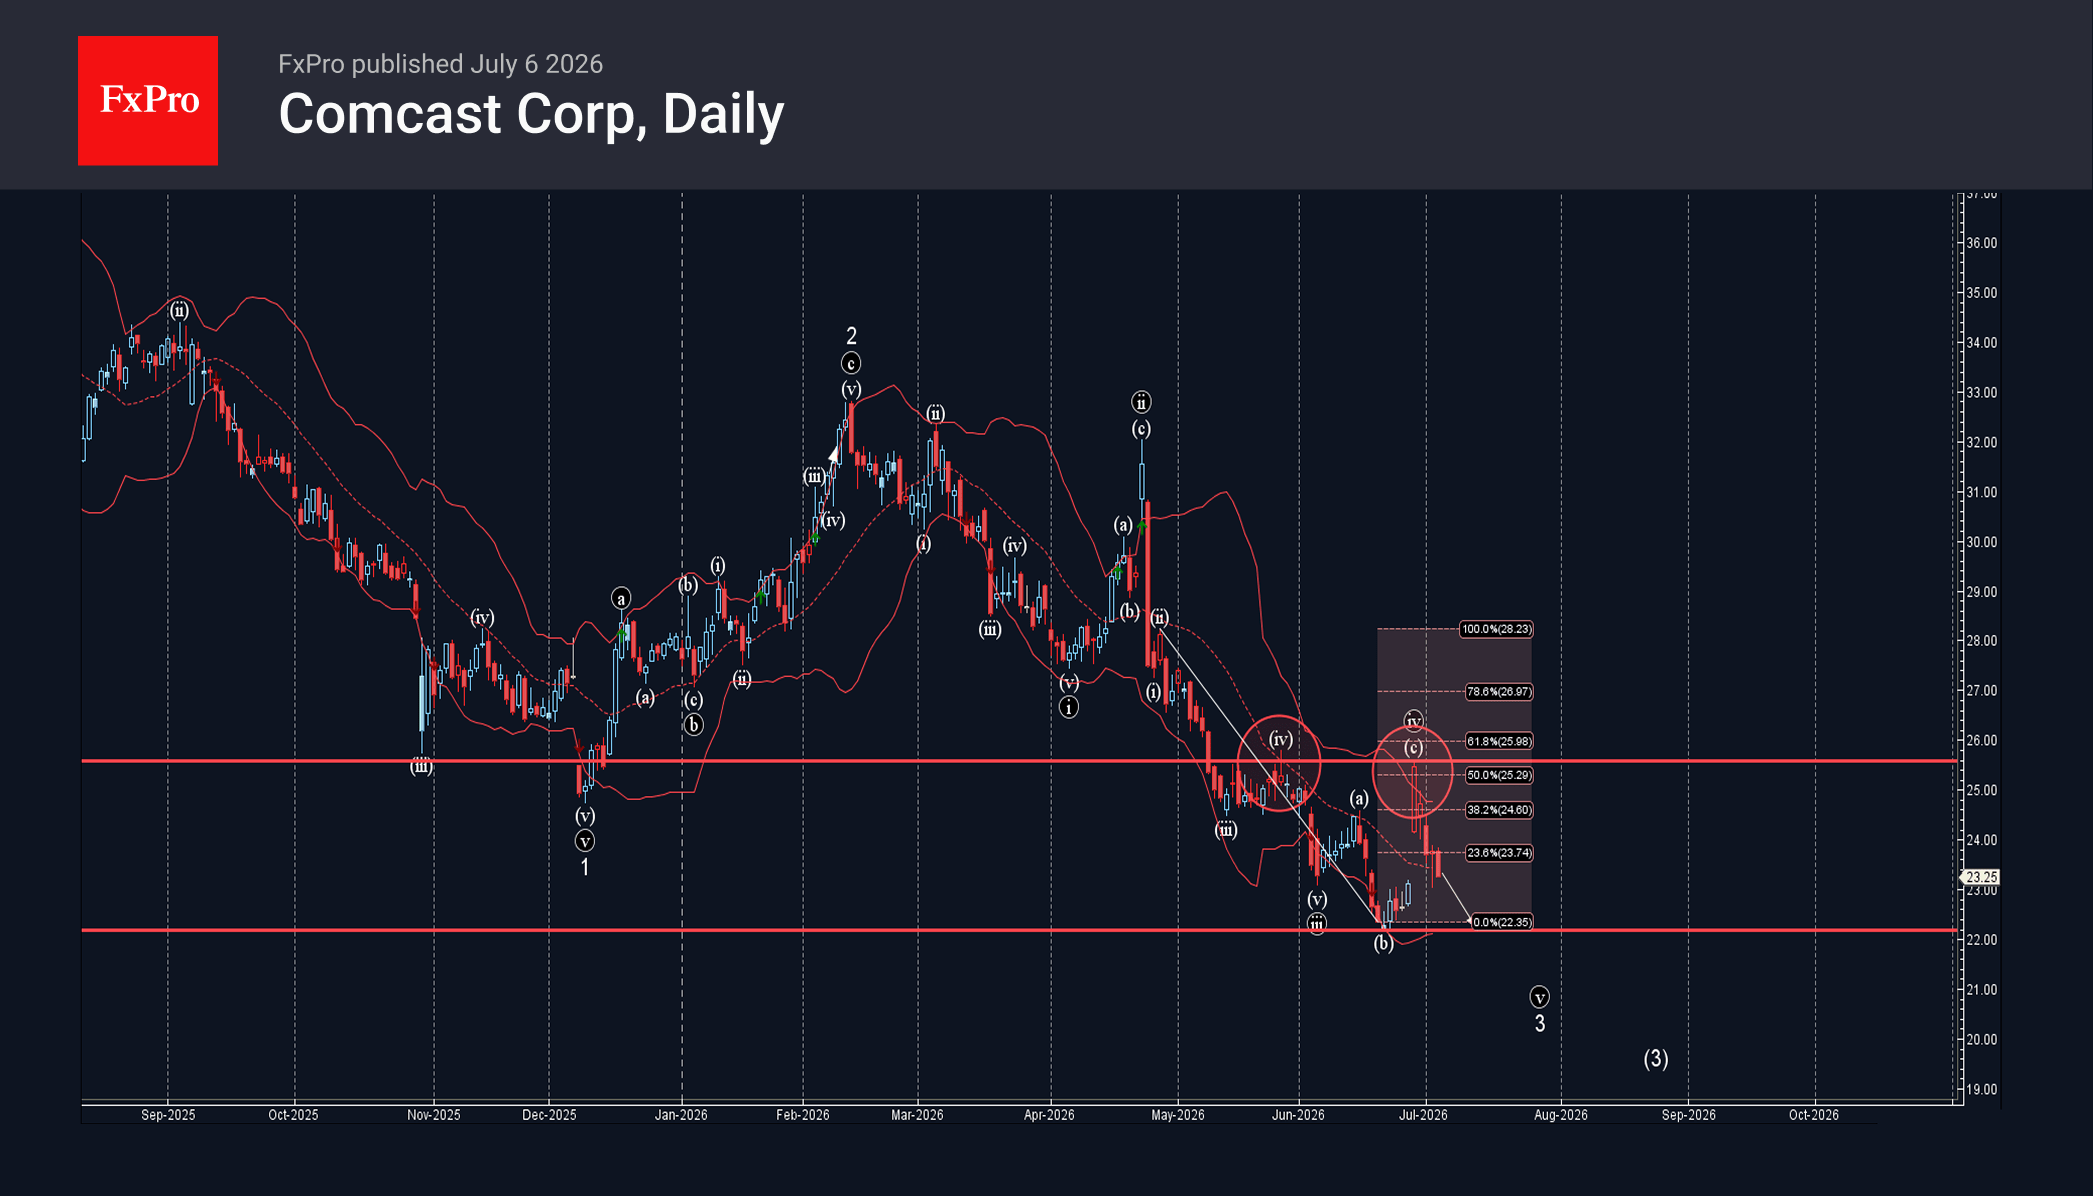
Comcast: ⬇️ Sell
– Comcast reversed from resistance zone
– Likely to fall to support level 22.20
Comcast recently reversed from the resistance zone between the pivotal resistance level 25.55 (top of the previous correction iv), upper daily Bollinger Band and the 50% Fibonacci correction of the downward impulse from April.
The downward reversal from this resistance zone stopped the previous minor ABC correction (iv) from April.

Given the overriding downtrend on the daily charts, Comcast can be expected to fall further to the next support level 22.20 (which stopped earlier correction b).