Technical analysis
Coca-Cola Wave Analysis – 03 March, 2020
March 03, 2020 @ 18:02 +03:00

- Coca-Cola rising inside impulse wave 1
- Likely to rise to 391.00
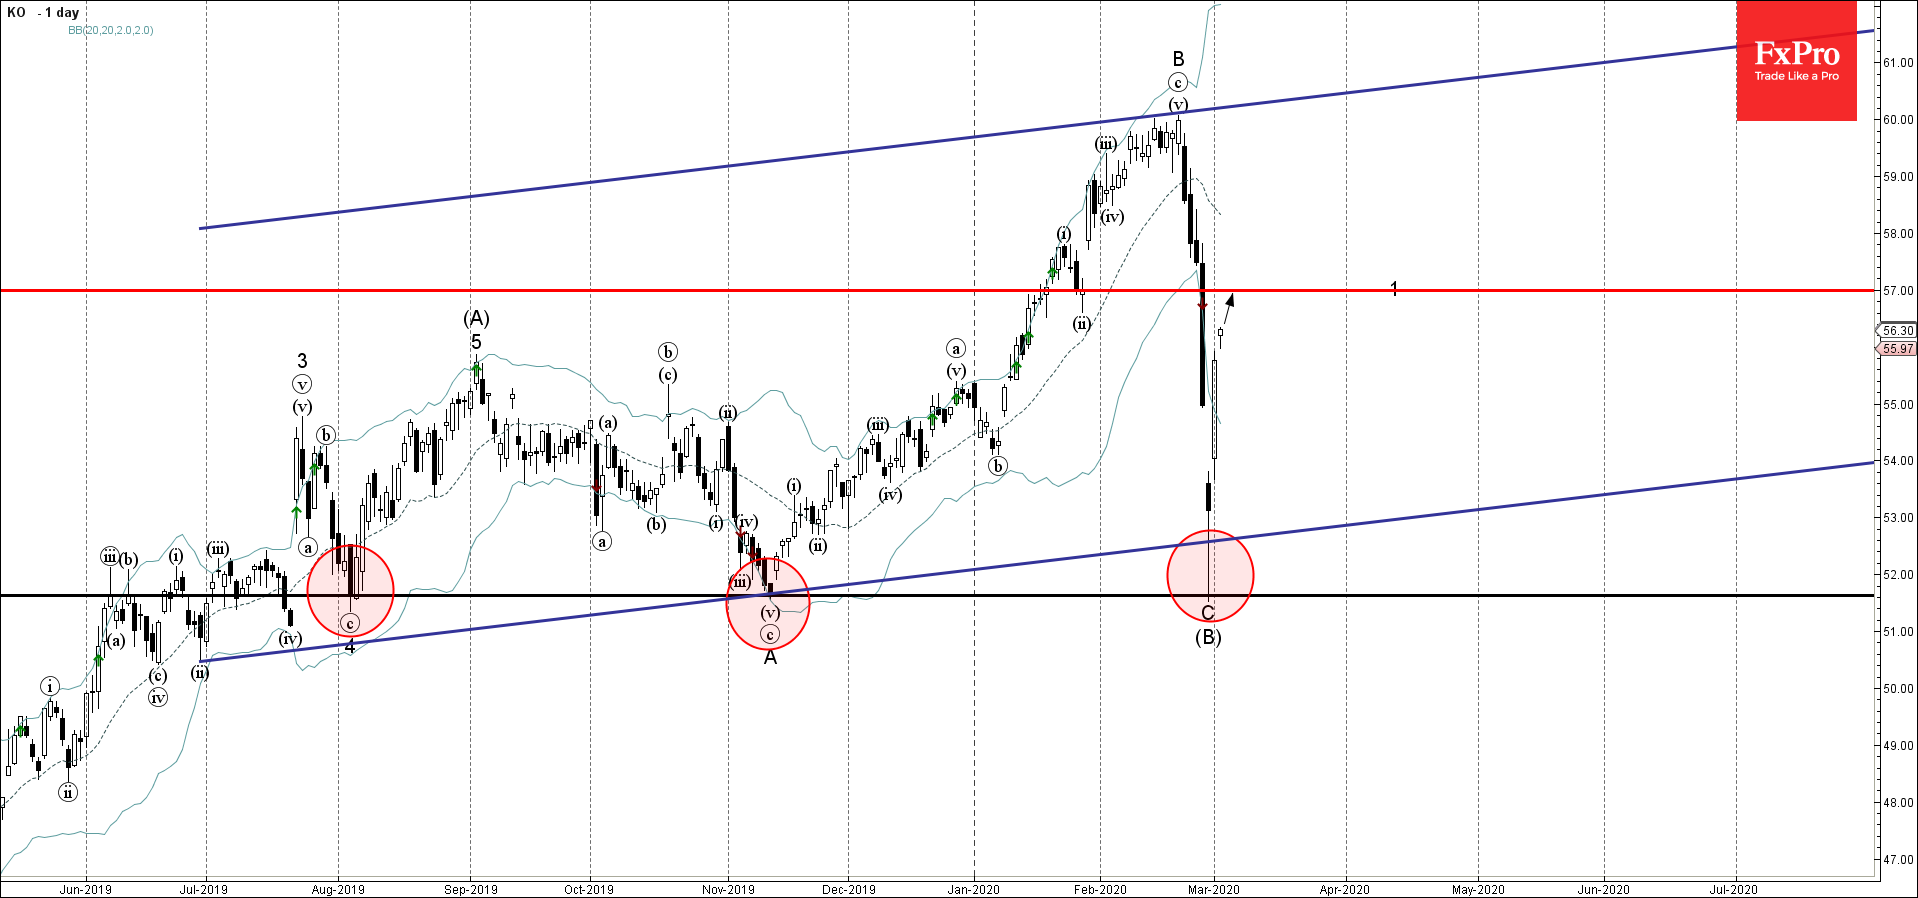
Coca-Cola recently reversed up powerfully from the support area lying between the long-term support level 51.60 (which has been reversing the price from August) and the lower daily Bollinger Band.
The upward reversal from this support zone created the daily Japanese candlesticks reversal pattern Hammer- which started the active impulse wave 1.
Coca-Cola is likely to extend the gains further toward the next resistance level 57.00 (former support from January and the target for the completion of the active impulse wave 1).


